Tokyo 23 Wards - Price per Square Meter and Tsubo for Condominiums with Year-on-Year Comparison [September 2026] Central 5 Wards +6%, Other 18 Wards +20%
Xiao Li (licensed real estate broker, 宅地建物取引士)Sales & Property Management Lead
19 min read
Everyone knows that used condominiums in Tokyo are "more expensive in the city center," but the noticeable price increases in the past year are actually outside the city center. When viewing condominium asking prices by ward, Minato and Chuo wards are almost flat, while Setagaya, Katsushika, Toshima, and Nakano wards have risen significantly.
This article lists the building price per square meter of Tokyo's 23 wards condominiums (median asking price ÷ exclusive floor area) as published monthly by Urbalytics, comparing September 2026 with the same month in the previous year (September 2025). It summarizes the differences between the central 5 wards (Chiyoda, Chuo, Minato, Shinjuku, Shibuya) and the other 18 wards, wards with large increases, possible reasons behind the changes, and points condominium owners should check when considering selling.
Key points of this article
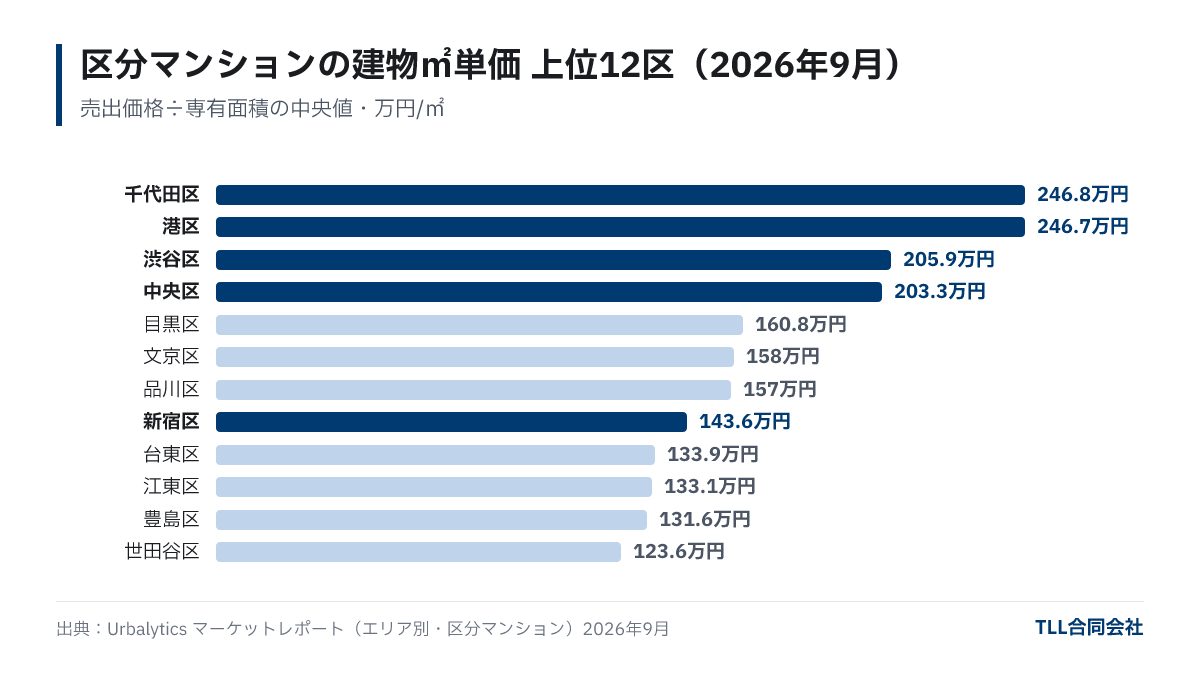
- As of September 2026, the median condominium building price per square meter (asking price) in Tokyo's 23 wards was highest in Chiyoda Ward at ¥2,468,000/sqm and Minato Ward at ¥2,467,000/sqm, with the lowest being Adachi Ward at ¥663,000/sqm (Urbalytics Market Report).
- Year-on-year, the weighted average price per sqm in the central 5 wards rose from ¥1,953,000 to ¥2,075,000 (+6.2%), while the other 18 wards rose from ¥952,000 to ¥1,140,000 (+19.7%), showing a larger increase outside the city center.
- The ward with the largest increase was Setagaya (+27.6%), while Minato decreased by −1.8% and Chuo increased by +0.9%. The number of properties listed for sale grew approximately 1.5 times in the central 5 wards and about 1.3 times in the other 18 wards over the same year.
Tokyo 23 Wards Condominium Price per Square Meter Ranking (September 2026)
As of September 2026, building price per square meter was nearly tied at first and second place between Chiyoda Ward (¥2,468,000/sqm) and Minato Ward (¥2,467,000/sqm), followed by Shibuya Ward (¥2,059,000/sqm) and Chuo Ward (¥2,033,000/sqm). Among the central 5 wards, Shinjuku Ward (¥1,436,000/sqm) ranked 8th behind Meguro, Bunkyo, and Shinagawa Wards. The lowest was Adachi Ward (¥663,000/sqm), about 3.7 times less than Chiyoda Ward.
Converted to price per tsubo (1 tsubo ≈ 3.31 sqm), Chiyoda and Minato Wards are about ¥8,150,000/tsubo and Adachi Ward about ¥2,190,000/tsubo. These are medians of asking prices at listing, not contract prices.
| Rank | Ward | Price per sqm Sep 2026 (¥1,000/sqm) | Converted price per tsubo (¥1,000/tsubo) | Price per sqm Sep 2025 (¥1,000/sqm) | Year-on-year Change | Listing Data Count (Sep 2025 → Sep 2026) | Median Asking Price (¥1,000) |
|---|---|---|---|---|---|---|---|
| 1 | Chiyoda Ward | 246.8 | 815.9 | 205.9 | +19.9% | 192 → 311 | 13,980 |
| 2 | Minato Ward | 246.7 | 815.5 | 251.1 | −1.8% | 843 → 1,349 | 15,100 |
| 3 | Shibuya Ward | 205.9 | 680.7 | 185.4 | +11.1% | 513 → 761 | 10,400 |
| 4 | Chuo Ward | 203.3 | 672.1 | 201.4 | +0.9% | 617 → 1,068 | 12,790 |
| 5 | Meguro Ward | 160.8 | 531.6 | 132.6 | +21.3% | 307 → 444 | 8,580 |
| 6 | Bunkyo Ward | 158.0 | 522.3 | 132.5 | +19.2% | 318 → 474 | 7,890 |
| 7 | Shinagawa Ward | 157.0 | 519.0 | 130.4 | +20.4% | 442 → 743 | 8,680 |
| 8 | Shinjuku Ward | 143.6 | 474.7 | 129.7 | +10.7% | 726 → 927 | 6,500 |
| 9 | Taito Ward | 133.9 | 442.6 | 111.8 | +19.8% | 372 → 480 | 5,980 |
| 10 | Koto Ward | 133.1 | 440.0 | 118.9 | +11.9% | 663 → 1,056 | 8,980 |
| 11 | Toshima Ward | 131.6 | 435.0 | 107.2 | +22.8% | 406 → 588 | 5,999 |
| 12 | Setagaya Ward | 123.6 | 408.6 | 96.9 | +27.6% | 745 → 935 | 7,250 |
| 13 | Nakano Ward | 109.7 | 362.6 | 89.4 | +22.7% | 269 → 425 | 5,280 |
| 14 | Sumida Ward | 108.6 | 359.0 | 97.2 | +11.7% | 351 → 382 | 4,590 |
| 15 | Arakawa Ward | 104.0 | 343.8 | 89.9 | +15.7% | 202 → 255 | 5,990 |
| 16 | Kita Ward | 101.7 | 336.2 | 91.4 | +11.3% | 245 → 329 | 5,440 |
| 17 | Suginami Ward | 95.1 | 314.4 | 84.8 | +12.1% | 405 → 508 | 4,805 |
| 18 | Ota Ward | 90.9 | 300.5 | 83.5 | +8.9% | 589 → 637 | 4,000 |
| 19 | Nerima Ward | 81.8 | 270.4 | 72.6 | +12.7% | 435 → 510 | 3,980 |
| 20 | Itabashi Ward | 78.2 | 258.5 | 74.4 | +5.1% | 510 → 627 | 3,220 |
| 21 | Edogawa Ward | 77.9 | 257.5 | 70.9 | +9.9% | 269 → 292 | 5,498 |
| 22 | Katsushika Ward | 70.5 | 233.1 | 57.4 | +22.8% | 269 → 331 | 3,985 |
| 23 | Adachi Ward | 66.3 | 219.2 | 58.6 | +13.1% | 430 → 496 | 3,880 |
Source: Urbalytics Market Report (by area, Tokyo). Figures for the same month in the previous year are from the monthly data on each ward's "Condominium" page, e.g., Minato Ward. Data include condominiums listed and contracted as collected by Urbalytics. Statistics use medians (outliers excluded by IQR method). Data compiled by TLL on October 2, 2026. Bold text indicates the central 5 wards. Price per tsubo is calculated by TLL multiplying price per sqm by 3.30578.
The Gap Between Central 5 Wards and Other 18 Wards is Narrowing
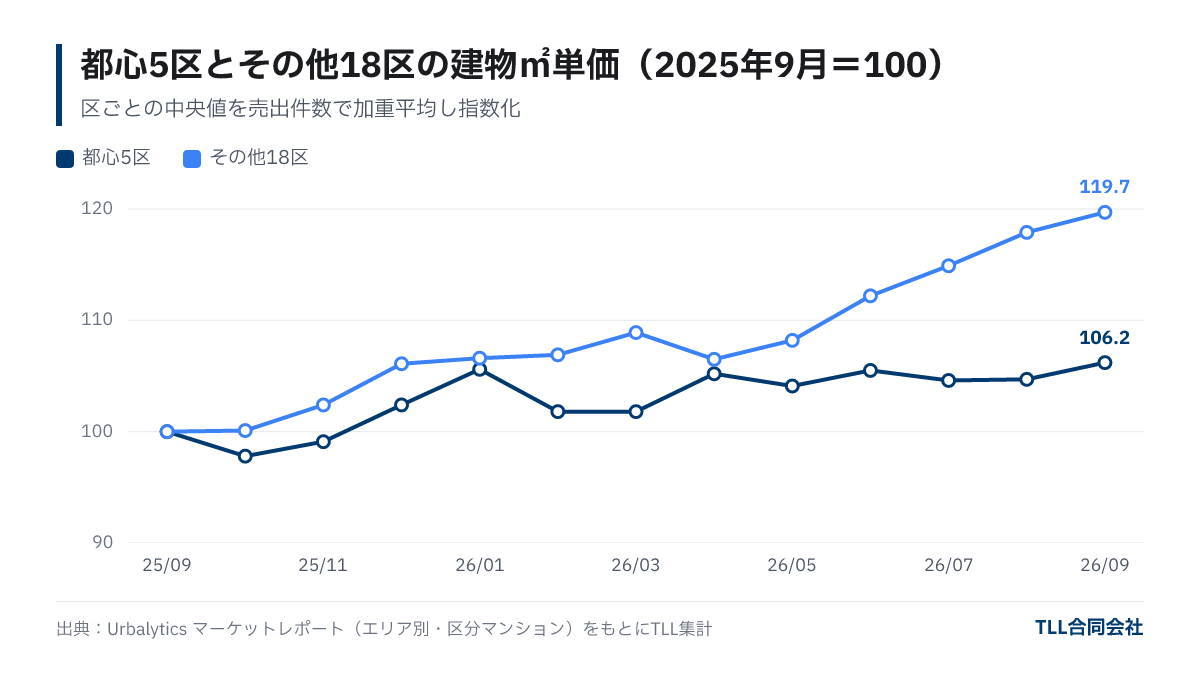
When comparing the weighted average median price per sqm by ward using listing counts as weights, in September 2025, the central 5 wards had ¥1,953,000/sqm and the other 18 wards had ¥952,000/sqm—a gap of roughly 2.05 times. By September 2026, the gap narrowed to about 1.82 times with prices of ¥2,075,000/sqm and ¥1,140,000/sqm respectively.
Indexed to 100 in September 2025, the price index for central 5 wards reached 106.2 in September 2026, while the other 18 wards rose to 119.7. The rise in the other 18 wards especially continued after May 2026, climbing from 108.2 in May to 119.7 in September over four months. The central 5 wards hovered roughly between 102 and 106 since January 2026.
Note: This weighted average was calculated by TLL from publicly available ward data and is not the overall median for all 23 wards. The weighted average for all 23 wards was ¥1,437,000/sqm (September 2026, 13,928 listings), matching the figure on Urbalytics Tokyo page.
Wards with the Largest Increase
The largest year-on-year increases were in Setagaya Ward (+27.6%), Katsushika Ward (+22.8%), Toshima Ward (+22.8%), Nakano Ward (+22.7%), Meguro Ward (+21.3%), Shinagawa Ward (+20.4%), Chiyoda Ward (+19.9%), and Taito Ward (+19.8%). Among the central 5 wards, only Chiyoda Ward approached 20% growth, Shibuya Ward (+11.1%) and Shinjuku Ward (+10.7%) had double-digit increases, while Chuo Ward (+0.9%) and Minato Ward (−1.8%) remained almost flat.
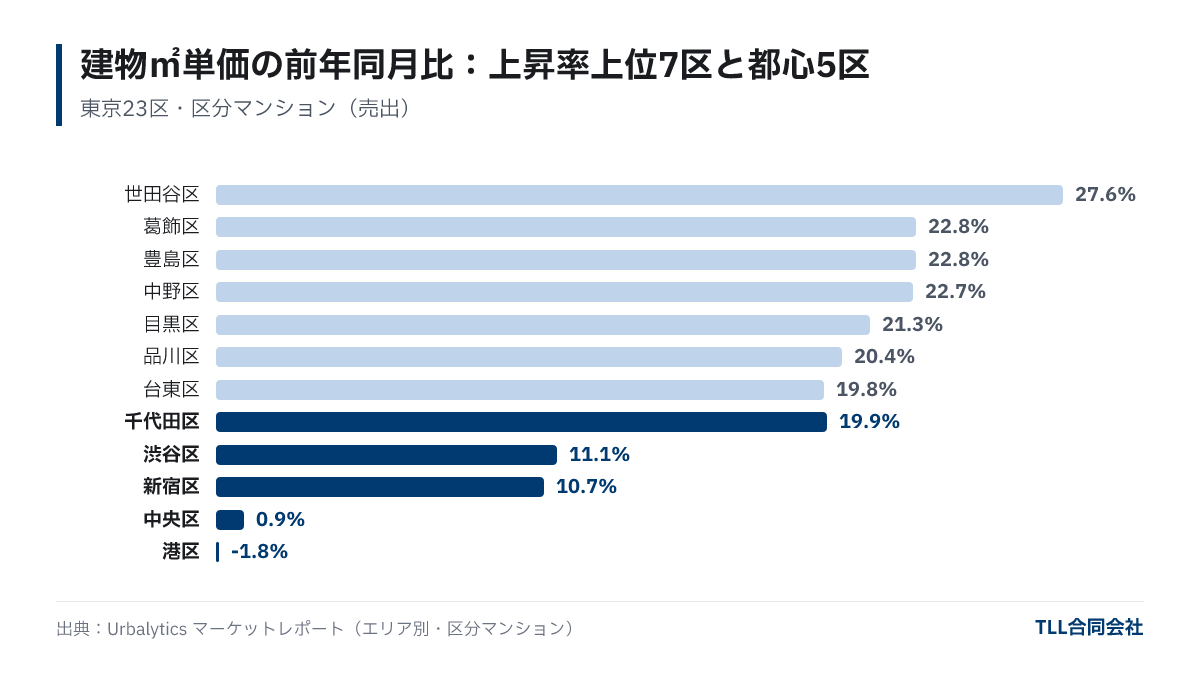
The wards with smaller increases include Minato, Chuo, Itabashi (+5.1%), Ota (+8.9%), and Edogawa (+9.9%). Not all lower-priced wards had large increases, so large variation between wards deserves attention.
Also, Chiyoda Ward had only 192 listings in September 2025, fewer than other central wards. The median price can fluctuate more significantly with fewer listings due to differences in inventory (building age, size, floor level).
Possible Reasons for These Movements
Two clear points from the data are:
- Listings have increased: The number of listings rose from 2,891 to 4,416 (about 1.5 times) in the central 5 wards, and from 7,227 to 9,512 (about 1.3 times) in the other 18 wards. Minato Ward increased from 843 to 1,349 listings. The counts are those captured by Urbalytics and may include changes in data collection scope. Despite increased supply, price growth at the higher end in the city center has stalled.
- Many price reductions occurred: Urbalytics's price reduction watch shows 6,778 condominium listings in Tokyo were reduced in August 2026, with a median reduction of −3.9%. In Minato Ward alone, 700 listings were reduced, median −4.0%.
Therefore, the greater price rises outside the city center may be due to high central prices pushing buyers to look toward Setagaya, Nakano, Toshima, Katsushika, etc., or because newer, conveniently located properties increased supply, raising median prices in these wards. Which factor has a larger impact cannot be determined from this data alone. Future prices will be influenced by interest rates and supply, so predictions beyond this data are uncertain.
What Owners and Investors Should Check
The ward median is a helpful reference when considering your own unit's price but should not be applied directly. When contemplating selling, check the following:
- Calculate your unit price per sqm: Divide your estimated asking price by your exclusive floor area to find your unit price per sqm and compare it to the ward median. If there's a large difference, consider whether age, distance from the station, floor level, or size explains it.
- Compare not by ward but by station or condominium: Prices differ widely even within the same ward depending on the station. It's best to compare listings and contracts for similar size and age at the same station or in the same building.
- Observe how listing numbers are changing: When listings increase in the same area or building, buyers can compare more options, making price negotiations more frequent. Use this for timing and price setting.
- Expect a gap between asking and contract prices: The figures here are asking prices. Actual contract prices may be lower due to negotiations, so estimate net proceeds based on contract expectations.
- Deduct taxes and fees in your calculations: Tax rates change considerably depending on whether you have owned the property for more than 5 years (determined on January 1 of the year you sell). For details, see Long-term vs Short-term Capital Gains Tax, and for fees, see Real Estate Brokerage Fees.
An overview of the market from a yield and interest rate perspective is in Is Tokyo Real Estate in a Bubble? If you want to know approximately how much your unit could sell for now, use TLL's free appraisal.
Frequently Asked Questions
Q. What is the building price per square meter?
It is the asking price of a condominium divided by its exclusive floor area, showing how much per square meter the property is offered at. Urbalytics Market Report publishes medians by ward, based on asking prices at listing, not contract prices.
Q. Which are the central 5 wards?
This article defines the central 5 wards as Chiyoda, Chuo, Minato, Shinjuku, and Shibuya. As of September 2026, four of these wards except Shinjuku have prices over ¥2,000,000/sqm.
Q. Minato Ward's price per sqm dropped year-on-year. Does that mean prices are starting to fall?
Minato Ward's −1.8% change can be seen as nearly flat. The number of listings increased from 843 to 1,349 over the same period, reflecting changes in the mix of properties offered. It's not reasonable to judge a price drop based on one month's numbers alone.
Q. How do I convert price per sqm to price per tsubo?
Since 1 tsubo is about 3.31 sqm, multiply the price per sqm by 3.31 to get an approximate price per tsubo. For example, ¥2,467,000/sqm in Minato Ward becomes about ¥8,150,000/tsubo.
Summary
- In September 2026, Tokyo's 23 wards condominium building price per sqm had the highest prices in Chiyoda (¥2,468,000/sqm) and Minato (¥2,467,000/sqm), and the lowest in Adachi Ward (¥663,000/sqm), with roughly a 3.7 times gap.
- Year-on-year, weighted average prices rose +6.2% in the central 5 wards and +19.7% in the other 18 wards, narrowing the price gap from about 2.05 times to 1.82 times.
- The largest increase was in Setagaya (+27.6%), while Minato (−1.8%) and Chuo (+0.9%) remained almost flat. Listings increased approximately 1.5 times in the central 5 wards within the same year.
- When considering selling, use sales data and listings at the same station or condominium rather than ward medians; consider listing trends and net proceeds after taxes and fees.
Featured image (illustration): Photo: Risto Kokkonen / Unsplash
About this article
- Author
- Xiao Li(Sales & Property Management Lead)Qualifications: Real Estate Transaction Specialist, Building Management Specialist
Leads the practical work connecting investment property purchases and sales with property management after acquisition. At NTT Communications, he spent more than eight years managing digital transformation projects for major corporate clients, coordinating work from requirements through implementation and operation. He applies this experience in managing multiple stakeholders to real estate transactions and property management. He holds Japan's Real Estate Transaction Specialist and Building Management Specialist qualifications. At TLL, he oversees the property management business and handles sales strategy, investor proposals, contracts, settlement and handover. His property assessments consider rental income together with loan terms, repair costs and building age at exit, keeping purchase decisions connected to subsequent operations. His articles also cover decisions during ownership, including portfolio expansion, refinancing and management for owners living overseas.
View profile → - Publisher
- TLL合同会社宅地建物取引業 東京都知事(1)第108202号住宅宿泊管理業 国土交通大臣(01)第F03424号
Data in this article cite their source and as-of date. Market conditions and regulations change, so check the latest information and consult a professional before deciding. Translated from the Japanese original.