Trends in Listing Inventory in Tokyo's 23 Wards [September 2026] - Changes in Whole-Building and Unit Sales by Ward
Eiichi Suto (licensed real estate broker, 宅地建物取引士)Real Estate Brokerage / Renovation
20 min read
When considering selling, alongside price and yield, one important concern is "how many properties are currently listed for sale in the same area." If many properties are listed, buyers have more options to compare, making negotiations over price and conditions more likely. Conversely, if listings are few, your property is more likely to catch buyers' attention.
This article summarizes the listing inventory (monthly data counts) of whole-building income properties and unit condominiums in Tokyo’s 23 wards, aggregated by ward from the publicly available market report by Urbalytics, operated by TLL LLC (September 2026 data). It compares the figures with those from the same month in the previous year (September 2025) and also explains points to be cautious about when interpreting the numbers.
Key points of this article
- The total listing inventory for whole-building income properties in Tokyo’s 23 wards rose from 1,670 units in September 2025 to 1,946 units in September 2026, a 16.5% year-on-year increase (Urbalytics Market Report).
- Out of the 23 wards, 19 saw an increase in whole-building listings compared to the previous year, with notable rises in Katsushika Ward (60 units → 94 units, +56.7%) and Shinjuku Ward (89 units → 127 units, +42.7%). Meanwhile, listings decreased in four wards: Adachi, Edogawa, Shinagawa, and Suginami.
- The total number of unit condominiums across the 23 wards increased from 10,118 units to 13,928 units (+37.7%), but the monthly fluctuation was large, reaching 19,395 units in June 2026, suggesting possible changes in data collection scope.
How did the listing inventory trend in Tokyo’s 23 wards?
The total number of whole-building income listings across the 23 wards increased from 1,670 in September 2025 to 1,946 in September 2026. Month by month, the count hovered around 1,500 units from November 2025 to March 2026, then ranged from 1,680 to 2,122 units since May 2026, maintaining a generally higher level.
| Month | Whole-Building Income (23 Wards Total) | Unit Condominiums (23 Wards Total) |
|---|---|---|
| September 2025 | 1,670 units | 10,118 units |
| October 2025 | 1,775 units | 10,106 units |
| November 2025 | 1,569 units | 9,741 units |
| December 2025 | 1,531 units | 9,478 units |
| January 2026 | 1,506 units | 9,587 units |
| February 2026 | 1,467 units | 10,696 units |
| March 2026 | 1,566 units | 11,988 units |
| April 2026 | (1,170 units・missing data) | 10,338 units |
| May 2026 | 1,680 units | 16,424 units |
| June 2026 | 2,122 units | 19,395 units |
| July 2026 | 1,744 units | 15,459 units |
| August 2026 | 1,795 units | 11,959 units |
| September 2026 | 1,946 units | 13,928 units |
Source: Urbalytics Market Report (area-specific data for Tokyo Metropolitan and ward-by-ward whole-building income and unit condominiums, monthly data counts), aggregated by TLL for the 23 wards. These counts include listings that are for sale and those already contracted in the month, and are not contract counts. April 2026’s whole-building data is missing about 35% due to one data source not being available. Data as of September 2026 (accessed October 2, 2026).
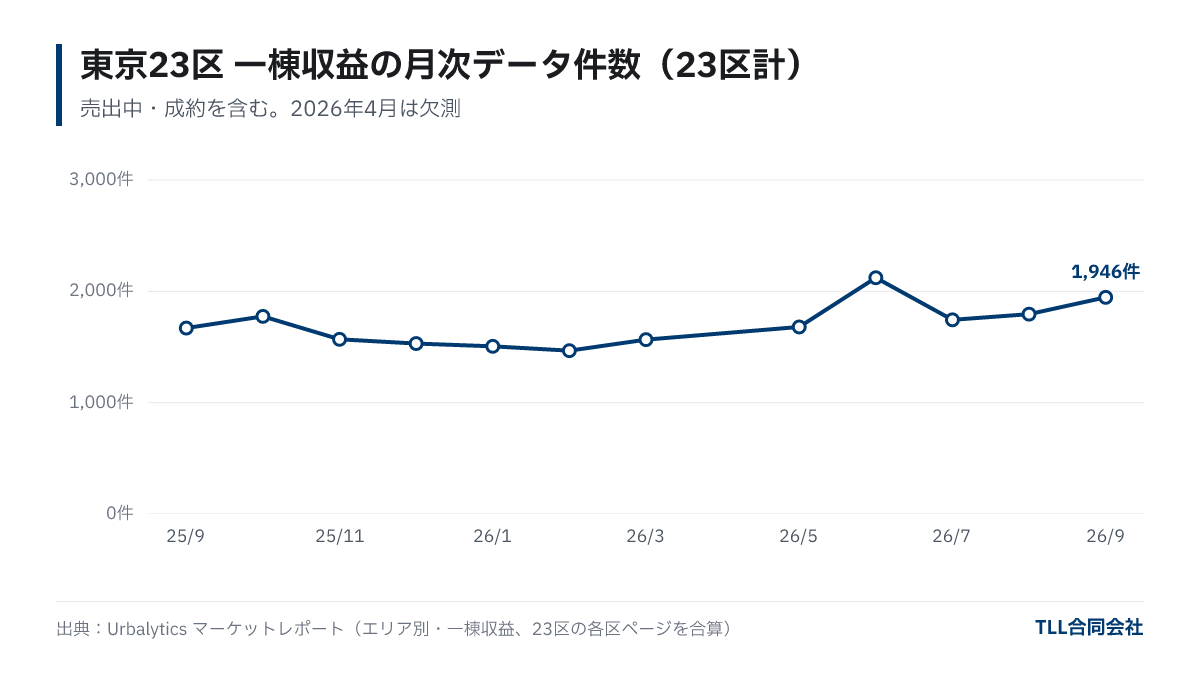
The 1,170 units reported for whole-building income properties in April 2026 is flagged on the Urbalytics ward pages as missing about 35% of data because one source (Rakumachi) was unavailable for that month only. The drop does not reflect an actual sudden market decline, so it is left blank in graphs.
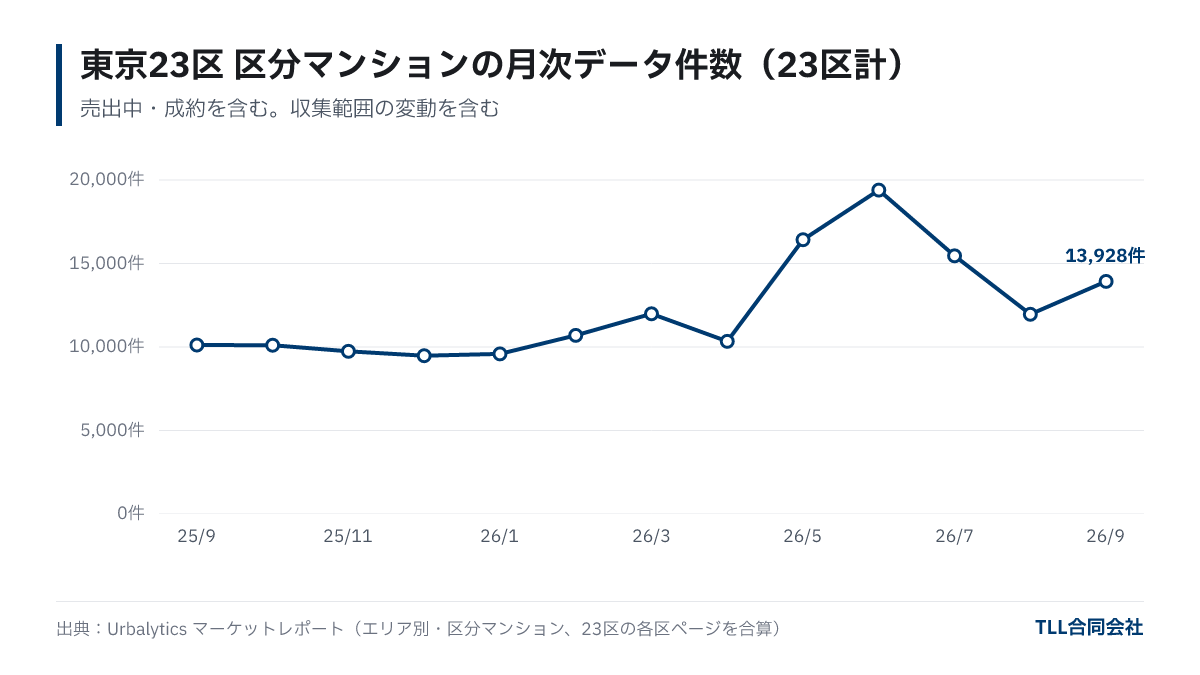
Unit condominium listings increased from 10,118 in September 2025 to 16,000–19,000 units around May-June 2026, then returned to 13,928 units in September 2026. Such large fluctuations over six months are difficult to explain by market inventory changes alone and likely include changes in data collection coverage. Therefore, unit condominium data changes should be treated as reference only.
Wards with increased or decreased whole-building inventory
Comparing the number of whole-building income property listings by ward with the previous year, 19 of the 23 wards saw increases while 4 wards saw decreases. The wards with the largest growth rates were Chiyoda (16 units → 38 units), Katsushika (60 units → 94 units), Shinjuku (89 units → 127 units), Chuo (24 units → 33 units), and Minato (32 units → 43 units). Decreases occurred in Adachi (141 units → 117 units), Edogawa (108 units → 93 units), Shinagawa (51 units → 47 units), and Suginami (123 units → 122 units).
| Ward | Whole-Building Sep 2025 | Whole-Building Sep 2026 | Year-on-Year Change | Unit Condominium Sep 2025 | Unit Condominium Sep 2026 | Year-on-Year Change |
|---|---|---|---|---|---|---|
| Chiyoda Ward | 16 units | 38 units | +137.5% | 192 units | 311 units | +62.0% |
| Katsushika Ward | 60 units | 94 units | +56.7% | 269 units | 331 units | +23.0% |
| Shinjuku Ward | 89 units | 127 units | +42.7% | 726 units | 927 units | +27.7% |
| Chuo Ward | 24 units | 33 units | +37.5% | 617 units | 1,068 units | +73.1% |
| Minato Ward | 32 units | 43 units | +34.4% | 843 units | 1,349 units | +60.0% |
| Arakawa Ward | 48 units | 64 units | +33.3% | 202 units | 255 units | +26.2% |
| Sumida Ward | 59 units | 77 units | +30.5% | 351 units | 382 units | +8.8% |
| Shibuya Ward | 44 units | 56 units | +27.3% | 513 units | 761 units | +48.3% |
| Meguro Ward | 31 units | 39 units | +25.8% | 307 units | 444 units | +44.6% |
| Nerima Ward | 88 units | 110 units | +25.0% | 435 units | 510 units | +17.2% |
| Setagaya Ward | 112 units | 138 units | +23.2% | 745 units | 935 units | +25.5% |
| Ota Ward | 99 units | 121 units | +22.2% | 589 units | 637 units | +8.1% |
| Kita Ward | 60 units | 73 units | +21.7% | 245 units | 329 units | +34.3% |
| Itabashi Ward | 110 units | 131 units | +19.1% | 510 units | 627 units | +22.9% |
| Taito Ward | 76 units | 90 units | +18.4% | 372 units | 480 units | +29.0% |
| Bunkyo Ward | 33 units | 39 units | +18.2% | 318 units | 474 units | +49.1% |
| Koto Ward | 52 units | 61 units | +17.3% | 663 units | 1,056 units | +59.3% |
| Nakano Ward | 109 units | 125 units | +14.7% | 269 units | 425 units | +58.0% |
| Toshima Ward | 105 units | 108 units | +2.9% | 406 units | 588 units | +44.8% |
| Suginami Ward | 123 units | 122 units | −0.8% | 405 units | 508 units | +25.4% |
| Shinagawa Ward | 51 units | 47 units | −7.8% | 442 units | 743 units | +68.1% |
| Edogawa Ward | 108 units | 93 units | −13.9% | 269 units | 292 units | +8.6% |
| Adachi Ward | 141 units | 117 units | −17.0% | 430 units | 496 units | +15.3% |
Source: Urbalytics Market Report (area-specific data for Tokyo Metropolitan and each ward’s whole-building and unit condominium pages). Counts include listings for sale and contracted data in the month. Unit condominium counts fluctuate widely, possibly due to changes in data collection scope. Data as of September 2026.
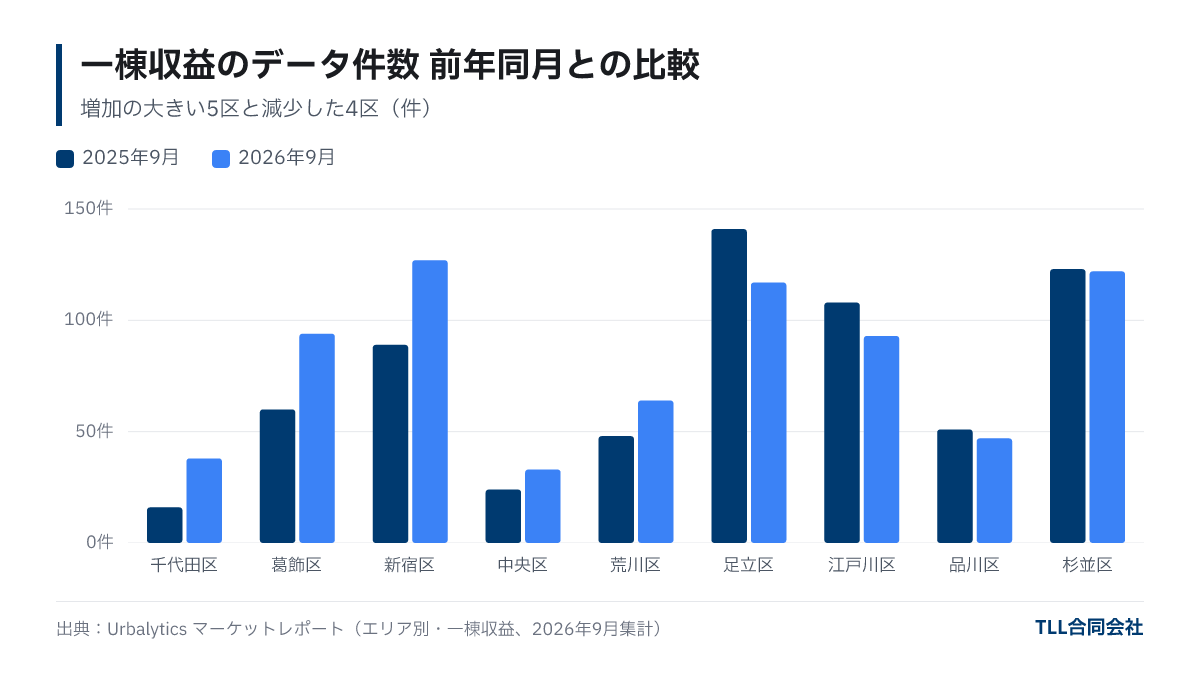
The percentage increase tends to appear larger in wards with fewer units, e.g., Chiyoda’s +137.5% reflects a jump from 16 to 38 units, which is an increase of 22 units. When comparing wards, it is advisable to consider both percentage and absolute numbers.

Possible reasons for the increase in inventory
From this data alone, it is not possible to identify the exact cause of the increase. Generally, the following factors are considered:
- An increase in owners deciding to sell: Owners deciding to list due to evaluating prices as being at a high level or sales due to inheritance and asset restructuring can drive listing inventory higher.
- Longer time on market: Even if the number of newly listed properties stays the same, if the time before contract extends, listings pile up in each month.
- Price revisions: According to Urbalytics’s price reduction watch, in August 2026, 767 whole-building income properties in Tokyo were marked down with a median reduction of −5.0%. This indicates there are properties that continue to be listed while adjusting prices downward.
- Changes in data collection scope: Variations in data sources or collection status can cause increased or decreased counts unrelated to actual market movements. This is especially notable for unit condominiums.
Moreover, an increase in listings does not necessarily mean yield rates have changed significantly. For example, the gross yield in Katsushika Ward was nearly flat, moving from 5.67% to 5.63%, and Shinjuku Ward from 4.29% to 4.21%. A detailed sorting of yields by ward is provided in the article "Tokyo 23 Wards Whole-Building Income Property Gross Yield Rankings [September 2026]."
What sellers and owners should check
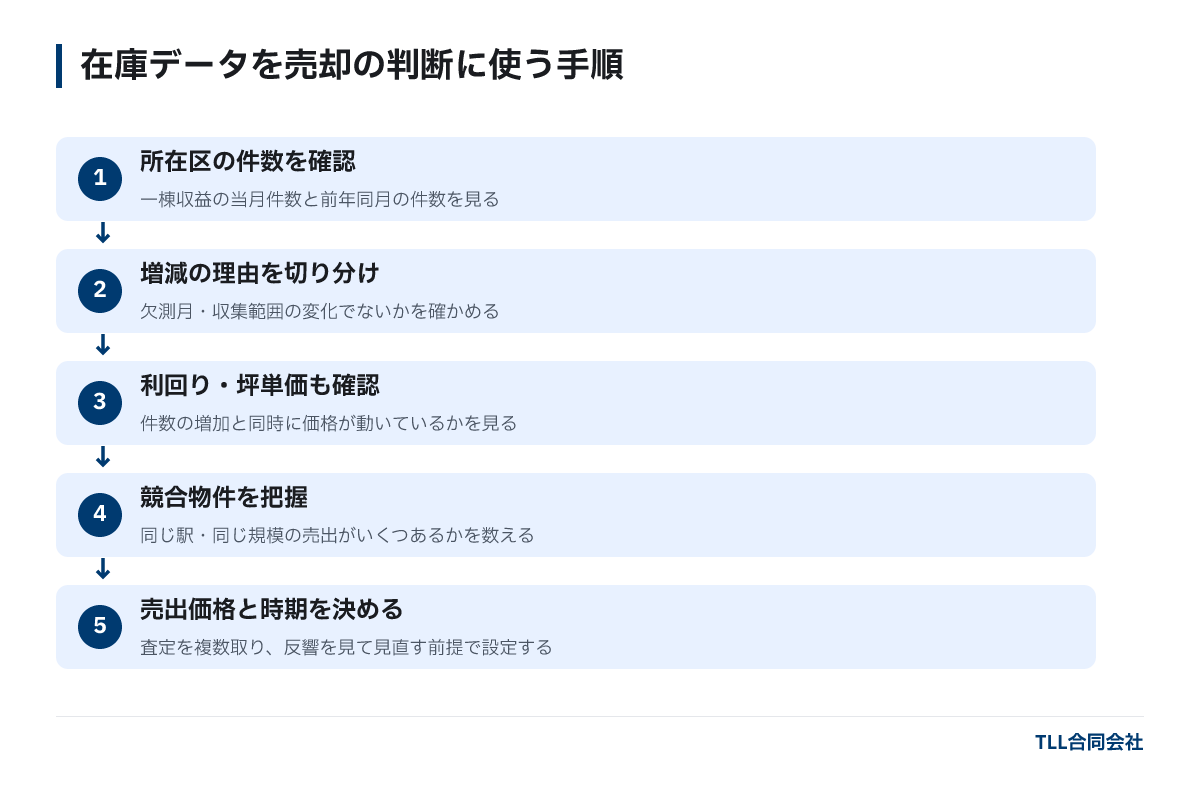
When using inventory data to inform selling decisions, verifying in the following order can reduce misinterpretation:
- Check the number of listings in your ward: Compare current month’s whole-building listing count with that from the same month last year.
- Separate reasons for increase/decrease: Confirm whether changes are due to missing data months (April 2026) or changes in data collection scope.
- Review yield and price trends as well: Confirm if yields are rising (prices dropping) along with the number of listings.
- Identify competing properties: Count not just the total in the ward but how many similar sized and priced properties are on sale near the same station.
- Decide listing price and timing: Compare multiple appraisals and plan how to adjust prices later based on market responses after listing.
When many competitors are listed in the same area, setting the listing price and presentation will more strongly affect the time until contract. TLL’s free appraisal service explains how to consider prices and approach listing strategy based on surrounding listings and contracted cases as well as rental levels. For advice on choosing between purchase and brokerage, see "Selling Whole-Building Apartments: Purchase vs Brokerage" and for the overall process, see "Income Property Selling Process."
Frequently asked questions
Q. Is "listing inventory" the number of unsold properties?
No. Urbalytics counts the number of sales data obtained in the month, including both active listings and properties already contracted. It is not the count of only unsold (leftover) properties nor contract numbers.
Q. Should I hurry to sell if the inventory is increasing in my ward?
Do not set your selling time based solely on listing count increases. It is recommended to consider yield and price trends, the number of comparable competing properties, and your own holding strategy together.
Q. Why did the count drop sharply in April 2026?
For whole-building income properties, one data source was unavailable only in April 2026, resulting in reported figures approximately 35% below actual market volume. This is not a market movement.
Q. Why does the number of unit condominiums fluctuate so much?
The monthly fluctuations are large and likely reflect not just market stock changes but also changes in data collection scope. It is safest to treat unit condominium counts as a reference alongside other indicators.
Summary
- Listing inventory for whole-building income properties in Tokyo’s 23 wards increased by 16.5%, from 1,670 units in September 2025 to 1,946 units in September 2026.
- Out of the 23 wards, 19 showed increased whole-building listing counts, with notable rises in Katsushika (+56.7%) and Shinjuku (+42.7%). Decreases were seen in Adachi, Edogawa, Shinagawa, and Suginami wards.
- April 2026’s whole-building data is a missing data month; unit condominium counts show large fluctuations probably due to changes in data collection scope, so careful interpretation is required.
- When considering selling, check not only listing counts but also yield, price movements, and competing properties near the same station with similar size and price.
About this article
- Author
- Eiichi Suto(Real Estate Brokerage / Renovation)Qualifications: Real Estate Transaction Specialist, General Insurance Solicitor Qualification, Assistant Commercial Facilities Planner, Level 2 Assistant Landscape Construction Management Engineer, Level 1 Assistant Civil Engineering Construction Management Engineer
Handles sourcing, acquisition and resale planning for income-producing and commercial properties across Greater Tokyo. He has more than 25 years of real estate experience, including sales and purchase work at Nomura Real Estate Solutions and Daikyo Anabuki Real Estate. He uses his industry network across central Tokyo and the wider metropolitan area to source off-market properties and assets with repositioning potential. He holds Japan's Real Estate Transaction Specialist qualification. When assessing an acquisition, he reviews tenancy, the building and property rights, then considers refurbishment costs and the expected resale price as part of the project economics. His approach connects the purchase negotiation with what can be improved and how the property can be sold. His articles explain sales of tenanted properties and options for older buildings, leasehold interests and other challenging conditions.
View profile → - Publisher
- TLL合同会社宅地建物取引業 東京都知事(1)第108202号住宅宿泊管理業 国土交通大臣(01)第F03424号
Data in this article cite their source and as-of date. Market conditions and regulations change, so check the latest information and consult a professional before deciding. Translated from the Japanese original.