Xiao Li

Xiao Li

Sales & Property Management Lead

Leads the practical work connecting investment property purchases and sales with property management after acquisition.

Overview

At NTT Communications, he spent more than eight years managing digital transformation projects for major corporate clients, coordinating work from requirements through implementation and operation. He applies this experience in managing multiple stakeholders to real estate transactions and property management. He holds Japan's Real Estate Transaction Specialist and Building Management Specialist qualifications. At TLL, he oversees the property management business and handles sales strategy, investor proposals, contracts, settlement and handover. His property assessments consider rental income together with loan terms, repair costs and building age at exit, keeping purchase decisions connected to subsequent operations. His articles also cover decisions during ownership, including portfolio expansion, refinancing and management for owners living overseas.

Experience & education

Professional Experience

NTT Communications

Education

Waseda University - Master in Information and Communications Engineering

Certification

Real Estate Transaction Specialist

Building Management Specialist
TLL Columns

Articles on Urbalytics

Fujisawa’s intergenerational housing: Who pays for discounted rents and community support?

Fujisawa’s intergenerational housing: Who pays for discounted rents and community support?

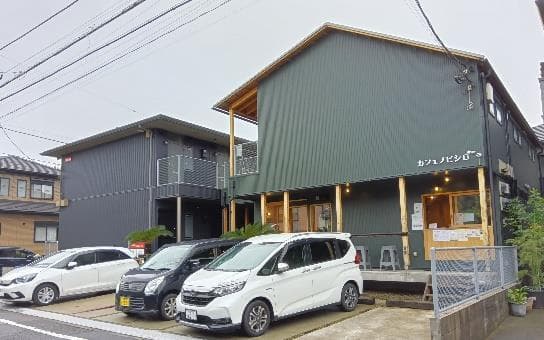
By Li | 20 Oct 2026Discounted rents for young residents can support neighborly interaction, but whether a rental building can operate sustainably still depends on who bears the cost of ongoing services.On October 20, TBS reported on operations at "Nobishiro House Kameino" in Fujisawa, Kanagawa Prefecture. Young and older residents live in the same rental property, with young residents participating in day-to-day interactions in exchange for reduced rent. According to the report, the property was fully occupied at the time—giving the discussion of demand from older renters a concrete operating case to observe.For typical rental-building owners, the point worth studying is how rent and services support each other. Even if young tenants pay less, someone still needs to organize activities, facilitate communication, and connect residents to professional resources as needs change. Full occupancy signals demand; net returns require separate math.Nobishiro House Kameino exterior: residences adjacent to a community space. Policy Research Institute, MLIT, public materials dated June 4, 2025, p.14; photo by the institute; used under PDL 1.0, image extracted from the original document. SourceBeyond the room: What way of living are residents buying?The project has been operating since 2021. In the TBS report, young tenants greet older neighbors about twice a week and organize a monthly tea gathering. Private rooms preserve solitude, while communal activities offer opportunities to meet neighbors proactively. The need it addresses is more specific than simply finding a low-price unit.An independent SUUMO Journal interview this month adds a critical boundary: young tenants take on a neighborly engagement role, and the operator explicitly distinguishes this from professional well-being/safety checks. If families assume discounted tenants are on-call caregivers, expectations will diverge from the actual arrangement.Therefore, the living arrangements and participation requirements should be clear when advertising rooms. People who prefer quiet solitude and those willing to participate in regular activities may rate the same unit very differently. In our Kiyose and Nagareyama tenant-positioning analysis, we discussed identifying demand first and then deciding whom to recruit; intergenerational living extends this to daily interaction styles.Project café space: interaction needs space—and ongoing operations. Policy Research Institute, MLIT, public materials dated June 4, 2025, p.14; photo by the institute; used under PDL 1.0, image extracted from the original document. SourceHalf-price rent is a visible operating investmentIn meeting materials released in September 2025, the operator listed monthly rent of 70,000 yen for older residents and 35,000 yen for young residents who take on a community role. MLIT research materials from the same year recorded the same prices. These explain the historical arrangement but are not necessarily today’s asking rents.If we use those historical figures for an arithmetic illustration only, a youth unit collects 35,000 yen less per month than 70,000 yen—a gap of 420,000 yen annually. This is a difference in potential rental income, not evidence of an actual cash loss. Whether the unit could have rented for 70,000 yen in the first place requires separate verification.Owners and operators should place this difference back into the full contract: who bears the concession, who pays personnel costs for organizing interactions, and which party covers costs generated by common spaces. Identical rents charged to residents can correspond to very different amounts received by the owner.If management changes in the future while the discount remains but interactions cease, the income transfer has lost its purpose. Replicable arrangements should have ongoing recruitment and handover mechanisms and not rely entirely on a single enthusiastic tenant.What benchmarks do standard small-unit rents provide?To gauge the conventional market facing young tenants locally, we queried Urbalytics’ sample around Mutsuai-Nichidai-mae Station. Within a 15-minute walk, for listings of 20–40㎡, we found 18 valid records, with a median monthly base rent of 62,750 yen.The same sample’s lower quartile was 51,250 yen/month and upper quartile 63,750 yen/month. These figures describe base rents in this specific filter only, helping operators understand nearby price options available to young tenants.You cannot simply subtract the project’s historical youth rent from 62,750 yen to claim monthly savings. The sample units and project rooms were not matched one by one, and listing times differ. Proper comparison must compare specific rooms, laying out interaction commitments and other costs together.Young residents may take on a community role not just for a discount. Whether they accept the interaction model and can align schedules will affect length of stay. For how small units serve youth demand, see the Hachioji student rental analysis; community roles need extra matching, and proximity to a university alone does not guarantee a steady pool of suitable participants.Another independent query found 11 income buildings for sale within a 15-minute walk of the station, with listed gross-yield lower quartile at 5.527%, median at 6.6%, and upper quartile at 6.686%. This addresses the ratio of listed annual income to asking price in nearby sale offerings.For owners holding rental buildings, these figures are a starting point for comparing operating options: if an operator proposes a gross yield similar to conventional rentals, they should also specify who bears the additional costs of community operations. Gross yield does not deduct repairs, taxes or staffing costs; vacancy assumptions must be checked for each property. It does not represent the owner’s net cash flow, nor does it establish that this project achieves 6.6%.Top: base monthly rent for individual units. Bottom: listed gross yield for whole buildings. Units and samples differ; do not combine them to compute a hypothetical income property. Source: Urbalytics, 2025-10-21 to 2026-10-20.Data notes: Query window is UTC first-observation date 2025-10-21 to 2026-10-20; residential MANSION category, LISTED status, base-rent basis. Records are currently stored listing values, not contracted rents, nor the rent trajectory for the same unit. The 18 rent records and 11 buildings are small-sample references. Whole-building sample includes properties with a listing or price-change record in-window; 13 raw records deduplicated to remove 2; closed transactions and undisclosed valuations excluded. Annual income uses listed values; whether on a full-occupancy assumption or as-is basis varies by source. The rent management-fee and total fields show unit inconsistencies and are not used here. Prefecture-level public-entry point: Kanagawa market report.Separate community work from property ownership responsibilitiesMLIT’s survey of this project shows the property owner leases to the operator, who then contracts with residents. The survey also records guaranty and equipment arrangements, as well as matters such as lease termination and disposal of remaining items. Beyond daily interactions, there is still formal property management.For owners, this means evaluating both the property contract and the operating plan. Whether residents’ services can be sustained depends on the operator’s staffing and collaboration resources; the owner’s cash flow depends on their own collection and cost terms.When discussing collaboration pricing, ask the counterparty to assign responsibilities to actual tasks: who maintains contact when a young tenant is temporarily away; who mediates when activities cause disagreement; who engages agencies when residents need professional support. This clarifies management roles—do not treat neighborly goodwill as a 24/7 service commitment.Common spaces also require separate accounting. They facilitate encounters, but area and day-to-day operations cost money. When replicating the model, do not count only the added rental rooms while ignoring how the interaction space will be run.Request a room-by-room operating statementThe Fujisawa case demonstrates a demand: some people will pay for arrangements that preserve independent living while enabling neighborly interaction. Whether it suits a given building depends on unit conditions and actual management capacity.Our cross-check also found discrepancies in public materials on unit counts and rents: TBS cites 7 units, while MLIT and operator materials cite 8. Materials from 2025 show older residents’ monthly rent at 70,000 yen, while SUUMO in October this year cites 80,000 yen; fee composition and applicable dates remain unverified. We do not interpret the difference as a rent hike, nor do we patch together whole-building income from disparate sources.Owners in Fujisawa evaluating similar partnerships should first request current room-by-room pricing with a fee breakdown from the operator, then ask for the owner’s actual collections schedule. Itemize the youth discount, common-space expenses, and day-to-day staffing inputs separately to judge whether the community model can continue under the next tenant cohort and the next manager.Tags#Japan intergenerational housing #Fujisawa City #Kanagawa real estate #Mutsuai-Nichidai-mae #multi-generational housing #rental building operations #senior tenants #youth rentals #rent analysis #property management #community operations #UrbalyticsReferencesTBS NEWS DIG/Yahoo, 2026-10-20, Same-day report and three-page main text.Policy Research Institute, MLIT, 2025-06-04, Study on multi-generational co-living communities, p.14.Nobishiro Co., Ltd., 2025-09-16, Cabinet Office meeting materials, p.7.SUUMO Journal, 2026-10-02, Interview on Nobishiro House operations.
Teikyo University in Hachioji: Assessing Student Rentals Around Otsuka

Teikyo University in Hachioji: Assessing Student Rentals Around Otsuka

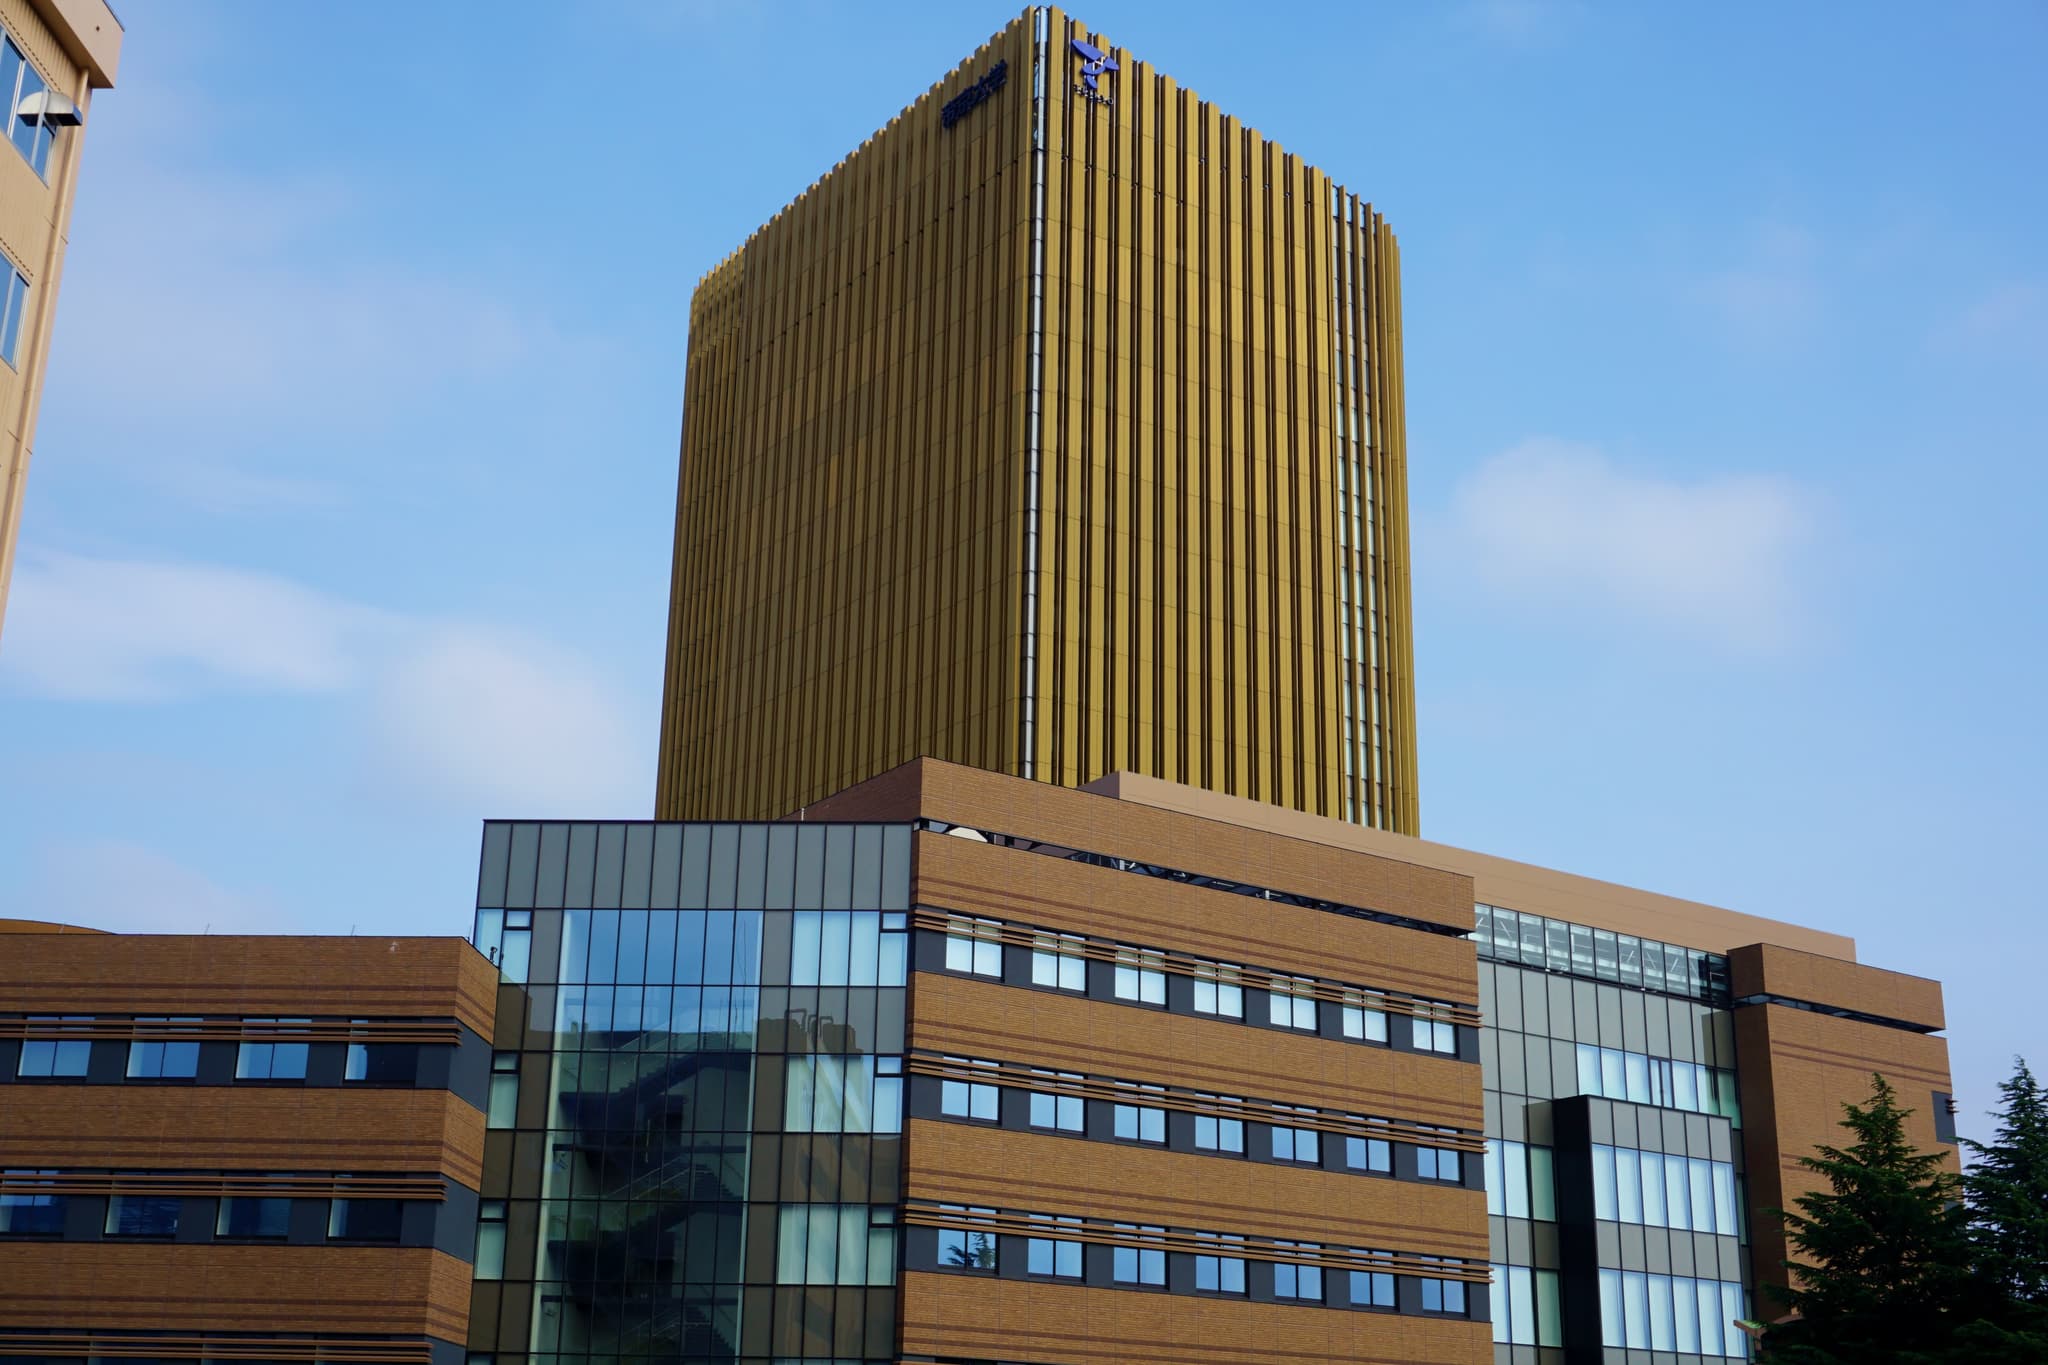
Ongoing campus investment preserves the demand source for nearby rentals; how much landlords can capture still depends on commuting routes and student budgets.Author: Li | Data verified as of October 17, 2026As the campus keeps upgrading, separate stock improvements from incremental demandKenbiya’s October 17 report places Teikyo University’s Hachioji campus within the debate over universities “returning to the city center”: while some institutions concentrate teaching functions downtown, Teikyo continues to operate a large suburban campus and to enhance its facilities. For owners of rental buildings around Otsuka, this is worth reading, but before valuation you should ask: what exactly has the university improved, and how many additional student renters will that bring?The university’s website confirms that Hachioji still houses the Faculties of Economics, Law, Letters, Foreign Languages, and Education, and that the campus already includes the Soratio Square classroom buildings, a library, and athletic facilities. These amenities underpin students’ study and life locally. Their presence supports the assessment that the campus continues to operate.Specific updates also have clear dates. On October 3, 2025, the university announced that the MELIC library’s media lounge had reopened on September 24, 2025, adding spaces for relaxing and reading, and upgrading network and charging facilities. Today’s coverage revisits this trajectory; one should not present a facility that reopened last year as a brand-new project starting now.This distinction directly affects underwriting. A better learning environment may help attract and retain students; converting that into incremental rental demand still depends on enrollment scale, commuting modes, and the off-campus living ratio. This verification did not obtain evidence sufficient to prove an increase in the number of student renters; therefore we do not translate “campus updates” into future rent growth.Soratio Square’s high- and low-rise teaching spaces. Totaltouch, July 17, 2016; Wikimedia Commons, CC BY-SA 4.0. Historical scene, unmodified.In Hachioji, renters don’t all take the same routeTeikyo University’s Hachioji campus is located in Otsuka. Official access information states it is about a 15-minute walk from the Tama Monorail’s “Otsuka–Teikyo-Daigaku” Station; buses also run to campus from Takahatafudo, Seiseki-Sakuragaoka, and Tama Center. The word “Hachioji” in the campus name does not mean students’ daily travel revolves around JR Hachioji Station.This changes the order of comparison for listings. For small units targeting enrolled students, first confirm the route from the residence to the commonly used campus gate, and then look at station distance on the map. Two properties both labeled a 10‑plus‑minute walk from a station may differ: if a unit lies in the opposite direction from the campus, the walk to school may be longer; if bus-reliant, late-evening classes or club activities bring headways into the student’s decision.The previously discussed Hachioji Station South Exit and Soto-no-Mori form a different living zone and cannot be used directly for pricing in Otsuka. Investors need to delineate the commuting catchment that actually competes with the target unit, not the entire city’s administrative boundary.The university’s own housing supply also sits within this catchment. The T-House international student dorm opened in April 2022 with 121 rooms, about a six-minute walk from campus, furnished, networked, and with shared common spaces. These students will not all enter the ordinary private rental market.For landlords, the dorm is a concrete comparator. Conventional apartments can offer a private kitchen, bath, and more autonomous living; dorms bundle furniture and communal space. When marketing, state clearly which need your room solves; do not assume that “near a university” guarantees selection. The Kyodo student district analysis can serve as a reference for another university-adjacent environment, but its transport and customer mix should not be copy-pasted to Otsuka.Student lounge and the plaza beyond. Totaltouch, July 17, 2016; Wikimedia Commons, CC BY-SA 4.0. Historical scene, unmodified.What exactly does a ¥53,700 monthly rent represent?To assess whether small units fit student budgets, start with asking rents within the same station catchment, not by back-solving rent from a whole-building yield. This Urbalytics screen of 15–35 m² units within a 15-minute walk of Otsuka–Teikyo-Daigaku Station yielded 61 samples.The lower quartile of base monthly rent is ¥37,000, the median is ¥53,700, and the upper quartile is ¥65,000. In other words, the middle half of samples sits between ¥37,000 and ¥65,000. This band is more useful than a single “average student rent”: even within the commuting catchment, pricing is clearly stratified.Panel A: base monthly rent for small units, unit: ten-thousand yen/month. Lower quartile 3.70; median 5.37; upper quartile 6.50; n=61. Data window 2025-10-18 to 2026-10-17, filtered by first-seen date; not achieved rents.Otsuka–Teikyo-Daigaku Station: distribution of small-unit monthly rents (Source: Urbalytics | 2025-10-18—2026-10-17 observation window | Not closed rents; excludes management fees)The median rent per area is about ¥2,362/m²·month, helpful for comparing asking rents per square metre across sizes; the ¥53,700 monthly total is closer to a student’s monthly housing outlay. These two medians are computed separately and should not be divided to reconstruct a “typical unit.” Management fees, utilities, and initial move-in costs must be added by listing.The current sample lacks standardized fields for interior refurbishment and bath/toilet separation, so higher rents cannot be directly attributed to a given finish. Owners planning to upgrade older stock should find true comparables close in size, age, and commuting conditions, then compare bath layout, internet, and interior state. Using the station catchment’s upper quartile as a post-renovation target rent skips the conditions that actually determine a renter’s willingness to pay.An 8.36% gross yield requires building-by-building income verificationWhen buying an entire rental building, the question becomes: what is the relationship between the asking price and the seller’s stated annual income? Within a 15-minute walk of the same station, only 10 whole-building samples met the filters and had listings or price updates during the past year.The lower quartile of gross yield is 7.12%, the median is 8.36%, and the upper quartile is 8.72%. With so few samples, this range is best used as a reference when evaluating specific properties, not as a stable return promise for the area.Panel B: listed gross yields for whole buildings. Lower quartile 7.12%; median 8.36%; upper quartile 8.72%; n=10. Period 2025-10-18 to 2026-10-17; excludes closed deals and non-public appraisals; not the same assets as Panel A.Otsuka–Teikyo-Daigaku Station: listed gross yields for whole buildings (Source: Urbalytics | 2025-10-18—2026-10-17 listing/price-change window | Not the same assets as Panel A)Here, gross yield equals listed annual income divided by asking price. Whether that income assumes full occupancy or reflects in-place income must be confirmed in each building’s materials; vacancy assumptions must be checked separately, and repairs and financing costs have not been deducted. For student-oriented buildings in particular, if move-outs cluster around graduation, the timing and cost of the next leasing round will directly affect annual cash flow.You can also review the Urbalytics Tokyo public market report to understand the broader market that includes Hachioji. But city-level monthly statistics and this station-catchment annual filter are different scopes; we do not infer a campus-driven premium from their difference.The 61 rental units are not the rent rolls of these 10 buildings. Do not multiply ¥53,700 by a building’s unit count and then plug in 8.36% to derive a seemingly market-validated acquisition price. Existing leases, vacant area, and comparable asking conditions for the target building should each feed into income verification.Incorporate campus factors into operations, without assuming future rent growthFor owners already holding small units in Otsuka, the most actionable step now is to check whether the room aligns with commuting life. Do photos and copy explain the route to campus? Are internet specifications clear? Can post-move-out repairs be completed before the next student leasing wave? All of these affect competitiveness at the same rent.If considering renovations, tie capex to a verifiable difference. For example, only if bath/toilet separation earns materially better leasing feedback among comps of the same size and route is there a basis to model the upgrade. Simply raising budgets for older apartments because campus facilities look newer is not yet evidence-based.For acquisitions, require rent rolls that separate in-place income from assumptions for vacant units, verify the months of concentrated student move-outs, and test asking rents for vacant units against nearby rooms under the same conditions. Teikyo University’s continued operation of the Hachioji campus can be cited as a demand source; without evidence of incremental students and actual leasing results, keep future rent growth out of the model.Data notesRental samples use Urbalytics’ MANSION residential category, include apartment-type housing, status LISTED; base rent excludes management fees; area 15–35 m²; within a 15-minute walk of the station. First-seen time is filtered by a UTC window; we use the currently stored asking values, not historical transaction prices for that date. 65 scanned, 61 retained after filtering; duplicates and outliers were not identified in this run; the scan ceiling was not reached. Derived totals for management fees show unit inconsistencies and are not used here.Whole-building samples are filtered by listing or price-change records within the period, excluding closed and OFFLINE records; cross-platform duplicates are merged; yields below 1% or above 25% are excluded, and all 10 samples were retained. Each panel shows its own quartiles, describing sample composition rather than changes before/after campus upgrades. Amounts and yields are rounded to the precision shown in the charts.Cover and campus photos: Totaltouch, July 17, 2016, Wikimedia Commons, CC BY-SA 4.0. Historical scenes used to illustrate campus spaces, not a 2026 construction site; images used as-is.Tags#TeikyoUniversity #Hachioji #OtsukaTeikyoDaigaku #TamaArea #StudentApartments #UniversityAreaInvestment #RentalOperations #SmallUnits #AskingRents #BuildingGrossYields #CommutingCatchment #JapanRealEstate #UrbalyticsReferences1. Kenbiya, October 17, 2026, Coverage of Teikyo University’s suburban campus strategy.2. Teikyo University, Hachioji campus facilities and access guide, verified October 17, 2026.3. Teikyo University, October 3, 2025, MELIC media lounge reopening notice.4. Teikyo University, Hachioji international student dormitory; Kyoritsu Maintenance, T-House operator introduction, verified October 17, 2026.5. Urbalytics, Tokyo public market report; custom statistics query on October 17, 2026.6. Wikimedia Commons, Totaltouch, Soratio Square I and Student lounge, licensed under CC BY-SA 4.0.
Kiyose and Nagareyama Are Both Attracting New Residents—Who Should Your Rental Building Target?

Kiyose and Nagareyama Are Both Attracting New Residents—Who Should Your Rental Building Target?

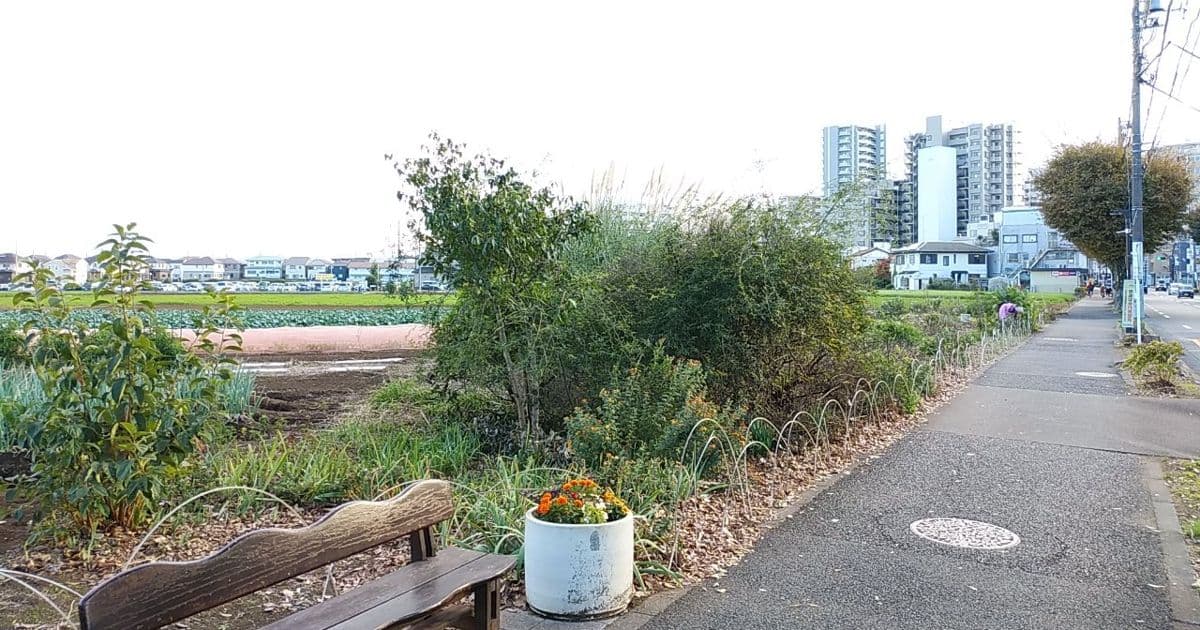
In-migration data for Kiyose and Nagareyama helps rental owners sharpen leasing strategy: first identify movers already within the local living area, then test whether units match their budgets.Author: Li | Data verified as of Oct 14, 2026Where newcomers come from determines which homes your units compete withKiyose and Nagareyama feature in Greater Tokyo growth discussions, but investors must ask: which product type will these newcomers occupy, and can existing rental stock capture them.On Oct 14, Rakumachi published an analysis reformatting 2025 inter-municipal migration by origins and destinations. It highlighted notable near-neighbor flows: Kiyose with Nerima Ward, and Nagareyama with Kashiwa City. The focus shifts from “how many came” to “where they came from.”This matters directly for leasing. People already living nearby may be upsizing or relocating closer to family or work; when they compare options, their current home is the reference point. To make the shortlist, your building must articulate its convenience and price clearly for this segment.The article uses domestic inter-municipal moves only; intra-municipal moves and overseas in-migration are excluded. It guides where to investigate but does not show how many choose to rent. Owner-occupiers, renters, and dependents moving with family create different demand profiles for rentals.Accordingly, we use in-migration as a lens to define target renter segments, then test rents against station-area listing data. City-level population curves do not directly feed a rent-uplift thesis for a specific building.Kiyose living-space example: Kamikiyoto 1-chome, Keyaki-dori toward the station, historical photo from Nov 2024. The adjacency of housing and farmland still needs to be translated into daily routes for a specific unit. Photo: Mikagekawase / CC BY 4.0.Single-person households stand out in Nagareyama’s in-mover survey as wellNagareyama attracts families with childcare and living environment, but treating all newcomers as family renters overlooks other demand.The city’s in-mover questionnaire collected 821 responses between Feb 1 and May 31, 2025. By household status: single-person 500, families 275, 46 no answer. At least in this wave, single in-migration was notably active.The survey covers a move-heavy season, and respondents are not the full-year cohort; it also lacks an own-versus-rent split. Owners can use it to test fit for single-occupancy units, but should not read response shares as citywide renter shares.An origin-detail tabulation has 814 responses: 53 from Kashiwa, 51 from Matsudo. Neighboring inflows are visible, alongside farther origins. For existing rentals, it is more useful to have nearby brokers log where inquiries come from, what pain points exist in current housing, and what budget tenants hope to trade into for their next home.Kiyose offers an age cue as well. In its 2026 revised comprehensive strategy, the city notes that the 25–29 population grew by roughly 15% over FY2020–FY2025. This supports ongoing monitoring of young renters’ needs; the city acknowledges multiple drivers and does not attribute all change to any single policy.Both places require segmenting “young households.” First-time independents and households adding a bedroom have different size and total-rent requirements. If your building already has varied unit types, evaluate who each serves; there is no need to retrofit everything to match a city brand.Illustrative apartment clusters around Nagareyama-Otakanomori, historical photo from Nov 2020, cropped. Used to observe spatial relationships between housing and transport nodes; does not represent current construction or listings counted in this article. Photo: Nesnad / CC BY 4.0.Both need new tenants, but the two stations imply different rent budgetsTo judge whether a unit makes the shortlist, assess size and total rent against the active market. We queried Urbalytics for residential listings around Kiyose and Nagareyama-Otakanomori station catchments, using the same size and walk constraints to reduce obvious scope differences.Median total asking rent in Kiyose is ¥106,000, and in Nagareyama-Otakanomori ¥141,000. Median base asking rent per square meter is about ¥1,906 and ¥2,579/month, respectively. Use unit price for like-for-like size comparisons; total rent better reflects monthly budgets. These medians are computed separately—do not divide one by the other to fabricate a “typical household.”This cross-sectional reference does not standardize building age or amenities. It shows that the listed stock around the two stations is marketed under different conditions; it does not resolve whether gaps reflect city appeal versus asset mix, nor quantify any rent lift from the latest in-migration.Whole-building listings add another lens via gross yield. In Kiyose, the median across 25 assets is 6.20%; around Nagareyama-Otakanomori there are only 4 assets, with a median of 4.78% (indicative only). Such a small sample in Nagareyama swings with individual assets and is not suitable for ranking the two locations.Data readout: Kiyose — 61 residential listings; median total rent ¥106,000; median unit price ¥1,906/sqm/month. Whole-building listings 25; median gross yield 6.20%. Nagareyama-Otakanomori — 128 residential listings; median total rent ¥141,000; median unit price ¥2,579/sqm/month. Whole-building listings 4; median gross yield 4.78% (indicative only).Method notes: first observed date window is 2025-10-15 to 2026-10-14 (UTC). Residential sample: MANSION category, LISTED status, 40–80 sqm, within 15 minutes’ walk; base rent excludes management fees and utilities. Statistics use the amounts currently saved for listings whose first-observed date falls in the window; not the then-prevailing price nor verified contracted rents.Whole-building sample comprises independent assets with a listing or price-change record within the same window; same walk-time condition; no unit-size constraint; excludes closed deals and undisclosed appraisals. Station catchments may cross municipal borders; the Nagareyama sample includes Kashiwa addresses. Gross yield equals listed annual income divided by list price, before vacancy and operating expenses.Two panels show residential asking rent unit prices and whole-building listed gross yields. Samples are independent; residential n=61/128, whole-building n=25/4. Upper chart unit: JPY/sqm/month; lower: %. Filters and limitations in Method notes. Source: Urbalytics.Ahead of the next leasing round, validate which mover segment your units can captureKiyose rentals should first check with nearby brokers on actual inquiries from younger tenants and near-neighbor movers. If you aim to capture more budget-sensitive tenants, benchmark total monthly rent against similar size and age stock, and include management fees to reflect the true burden. Active-market references inform pricing but cannot replace your own viewing feedback and signed leases.At Nagareyama-Otakanomori, evaluate single and family unit types separately. For families, test commute and drop-off/pick-up routes; for singles, space usability and the daily path to the station may drive choice. Let existing-tenant input and leasing feedback guide which upgrades matter—do not infer from city branding alone.For whole-building acquisitions, underwriting should still build up from each unit’s current lease, vacant unit mix, and capex plan. Residential unit pricing and whole-building gross yields come from different samples; combining them to back into a price produces numbers with no real asset behind them. The four Nagareyama observations are especially unfit as a citywide capitalization rate.Going forward, track regional supply via the Tokyo Open Market Report; treat this article’s custom station-catchment samples separately from monthly citywide stats. Prior Kiyose area coverage and population and rent analysis along the TX (Tsukuba Express) corridor provide context; this note adds the link between in-migration sources and current listings, without chaining earlier figures into a trend line.At the next Kiyose or Nagareyama vacancy, ask brokers to log each inquiry’s move purpose, desired size, and acceptable total rent, then compare with final lease terms. If “more space” and “similar budget” recur, prioritize which units in your building meet that pair; if inquiries skew to singles, align unit mix and marketing copy to those needs.Cover and Kiyose streetscape: Mikagekawase, Nov 2024, Wikimedia Commons original, CC BY 4.0; cover cropped. Nagareyama housing photo: Nesnad, Nov 2020, Wikimedia Commons original, CC BY 4.0, cropped.Tags#Kiyose #Nagareyama City #Nagareyama-Otakanomori #Nerima Ward #Kashiwa City #Matsudo City #In-migration #Mover demand #Asking rents #Unit mix #Rental operations #Gross yield #Greater Tokyo suburbs #UrbalyticsReferencesRakumachi, 2026-10-14, Analysis of in-migration sources for Kiyose and NagareyamaStatistics Bureau of Japan, 2025 Basic Resident Register Population Movement reference tables, published 2026Kiyose City, 2026-04-02, Comprehensive Strategy Reiwa 8 revised edition overviewNagareyama City, 2025-02-01 to 05-31 in-mover questionnaire summary (official PDF)Nagareyama City, origin details for the same questionnaire period (official PDF)Urbalytics, Tokyo Open Market Report; custom rent and whole-building listing statistics in this article, queried 2026-10-14, conditions in Method notes
Interest rates rose 0.37 percentage points in a month—can you cancel the contract you already signed?

Interest rates rose 0.37 percentage points in a month—can you cancel the contract you already signed?

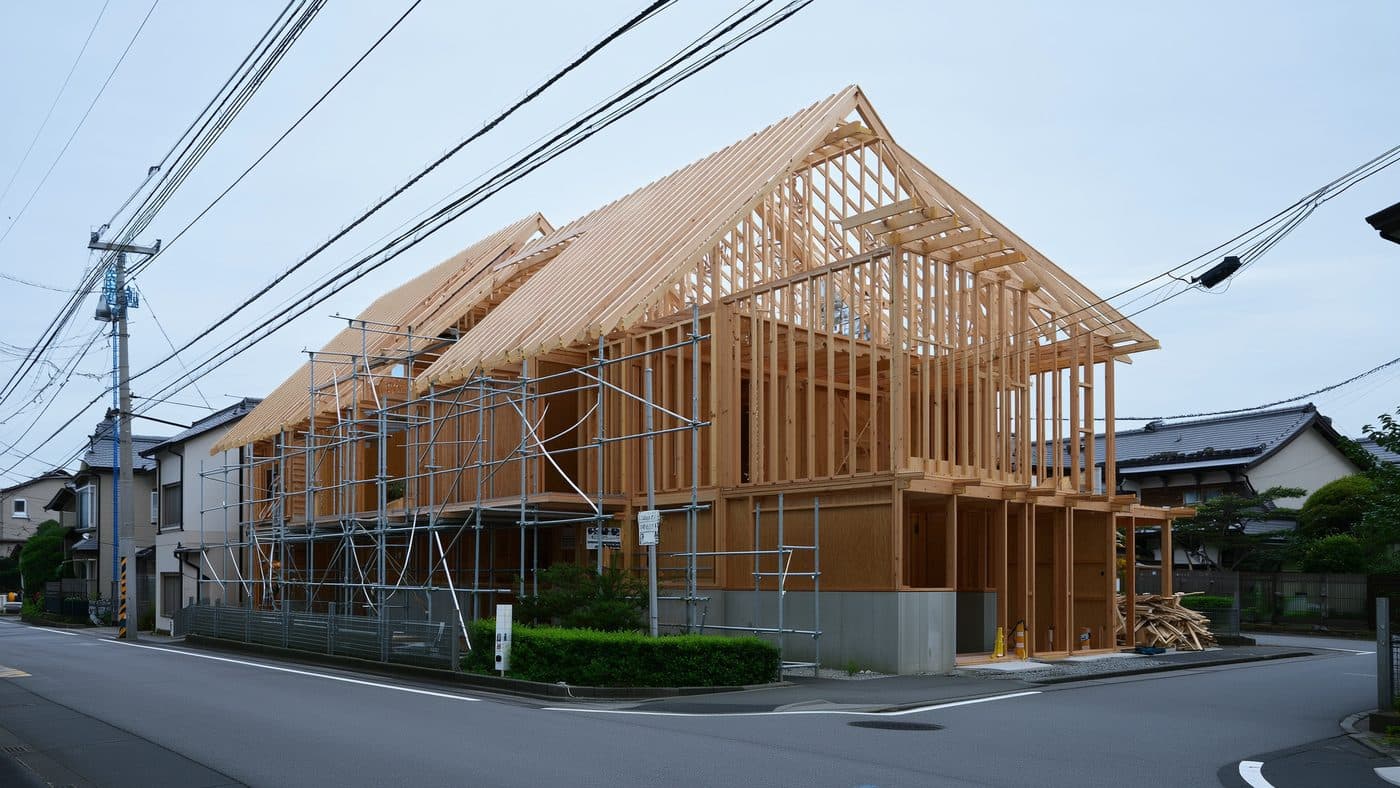
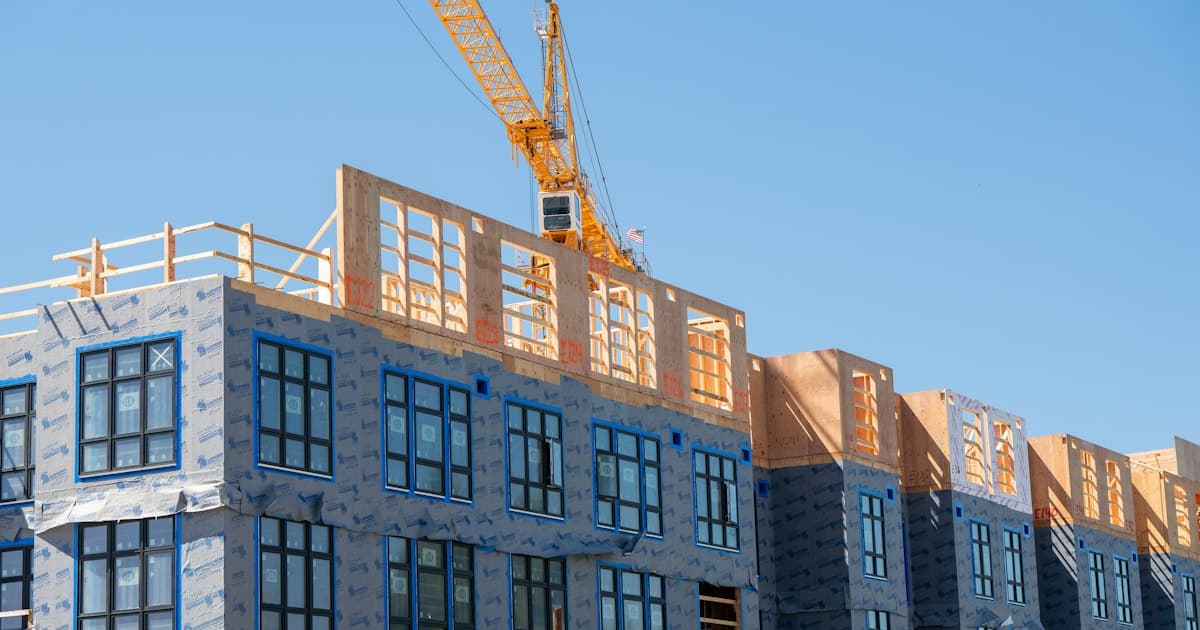
The October Flat 35 modal rate climbed to 3.83%, but what decides how much you lose isn’t the rate sheet—it’s how the loan contingency clause (ローン特約) is written in your contract.According to the Japan Housing Finance Agency, the October 2026 Flat 35 modal rate under the most common conditions—LTV at or below 90%, with the agency’s new group credit life insurance, and a repayment term of 21 to 35 years—settled at an annual 3.83%. In September it was 3.46%. One month, a 0.37 percentage-point jump.It’s easy to gloss over the numbers—until you drop them into a real mortgage. Borrowing 50 million yen over 35 years on a level-payment schedule, someone who signed in September would pay about 205,000 yen per month; signing in October pushes that to roughly 216,000 yen—about 10,800 yen more every month, or an extra about 4.55 million yen over 35 years. Rebase to April 2023, when rates were just over 1%, and the same loan’s total repayment would differ by around 31.57 million yen—nearly half a starter home in greater Tokyo.Illustrative image of a new wooden house construction siteThe harder part is that you don’t close on the day rates are announced. Especially with custom-built detached homes (注文住宅), months can pass between finding land, signing the land sale contract, signing the building construction contract, and the bank’s actual disbursement. The monthly payment you calculated at signing may no longer be the number when funds are released. A very practical question follows: if you’ve already signed, can you back out?Market sentiment: half are waiting, the other half are rushingNewly released figures from Zentaku (the National Federation of Real Estate Transaction Associations) and Zentaku Guarantee in the 2026 Housing and Residential White Paper (surveyed July 30–August 5, 2026; 5,000 men and women aged 20–65) quantify this split. Those saying “now is not the time to buy” reached 37.7%, up 3.0 points year over year; those saying “it is the time to buy” also rose, to 21.6%, up 0.8 points. Both ends expanded, while the undecided middle shrank.More interesting are the top reasons. Among skeptics, 47.2% cited “prices have become excessive.” Among optimists, a striking 64.4% chose “mortgage rates will continue to rise.” The same fact—rising rates—reads as “I can’t afford it” to one half and “buy now before it gets worse” to the other.Behavioral change is modest overall: 55.8% reported “no change.” But the remaining four-tenths took concrete steps—8.6% delayed or abandoned purchase, 8.1% cut loan size and budget, 7.0% switched areas, another 7.0% began shifting from variable to fixed rates, and 6.1% started comparing multiple lenders.Illustrative image of a contract and a floor planFor Chinese buyers in particular, note this: the mainstream response among domestic Japanese buyers is not to exit, but to adjust terms and keep buying. In other words, competition hasn’t disappeared—it has changed tactics.“Approved at a higher rate” and “not approved” are legally differentAttorney 田上嘉一 made this clear in an October 6 analysis: rising mortgage rates do not automatically allow rescission of a signed land or home sale contract.Real estate sale contracts in Japan typically include a “loan contingency” clause (ローン特約). The Real Estate Transaction Improvement Organization (RETIO) explains it this way: if all or part of the planned financing is not approved, the buyer may void the sales contract ab initio or exercise a right to rescind. In short, it protects the outcome of “funding was not obtained.”Here’s the rub:“Applied for 50 million yen; the bank approved only 40 million.” This is partial denial of financing and can fall within the scope of the loan contingency, giving the buyer a path to walk away without breach.“Got the full 50 million approved, but the rate rose from the expected 1% to 3%, making the monthly payment untenable.” As a rule, this does not constitute grounds to invoke the loan contingency. The money was approved, the contract remains valid, and the pain from the rate change is borne by the buyer.So the real focus isn’t whether the words “ローン特約” appear, but three concrete parameters: which financial institution you will apply to, the application amount, and the deadline by which approval must be obtained. The fuzzier these are, the less protection the clause offers when it matters.Land and building are two separate contracts: the breakpoint most often missedCustom-built homes (注文住宅) have a structural trap many overseas buyers don’t anticipate.In Japan, buying land and building a house are usually governed by two legally independent contracts: a land sale contract with the landowner, and a construction contract with the builder. Buyers think of them as one project—“I’m building my house on this lot”—but legally they do not automatically move in lockstep.The consequence: even if the land-side loan contingency triggers and the land contract is voided, the building construction contract does not automatically lapse. If only the land contract includes a loan contingency, you can end up “returning the land” while still being bound to the builder.The Civil Code does give the commissioning party an out: before completion, you may terminate by compensating the contractor for resulting losses. But “may terminate” is not the same as “void at no cost.” If design is done, building confirmation filed, or materials ordered, those costs—and the contractor’s damages—will be on the table.Illustrative image of a suburban neighborhood in the Greater Tokyo areaThe practical fix isn’t complicated, but you must raise it before signing:First, write cross-default explicitly into both contracts—if either is terminated due to loan failure, the other may be terminated as well.Second, make sure the deadlines in the loan contingency align across both land and building contracts. If the land-side contingency expires end-October and the building-side end-December, that gap is naked exposure where only one side may be cancelable.Urbalytics data: Mortgage rates have caught up with core-city one-building gross yieldsRate pressure isn’t only on owner-occupiers. On the investment side, the numbers are even starker.Urbalytics’ sales stats for one-building income properties around major stations in Tokyo and the three surrounding prefectures (July 2025–October 2026) show a clear concentric pattern in median gross yields: Yokohama Station at 6.34% (n=34), Ōmiya at 6.21% (n=50), Funabashi at 6.00% (n=47), while Shinjuku is just 4.08% (n=16; small sample, reference only). Narrow to the Nishi-Shinjuku postal area and the median drops further to 3.80% (n=19; reference only).Draw the Flat 35 line at 3.83% and the picture turns stark: in the urban core, median gross yields on one-building assets are now in the same ballpark as the coupon on a plain-vanilla owner-occupied fixed mortgage.Urbalytics Insight Owner-occupied mortgages can’t be used for investment property, and investment loans typically carry higher rates, so this isn’t a direct arbitrage formula. But it does show that in cores like Shinjuku, the safety buffer in valuations once supported by ultra-low rates is being eaten away. By contrast, the 6% band in Yokohama, Ōmiya, and Funabashi still leaves genuine spread to work with at this stage.In the same dataset, the median asking rent for condominiums in the Nishi-Shinjuku postal area is 149,000 yen per month, with a median unit rent of 5,110 yen per square meter. Rent growth is far lagging the jump in rates—exactly the arithmetic behind “asking prices are rising, but deals are stalling.”Repayment amounts for 50 million yen over 35 years by interest rate, and median one-building gross yields around major stations in the Tokyo metro areaBefore you sign, ask these four questionsJiji Press noted on October 7 a growing response: ultra-long-term mortgages. Products with terms up to 40 or even 50 years began with the JHF’s “Flat 50” in 2009 and have spread to online and regional banks. They do lower the monthly payment, but at the cost of repaying potentially past age 70 and inflating total interest. The Financial Services Agency has said it will step up oversight to check for lending beyond borrowers’ capacity.Extending the term to offset rising rates is essentially pushing the problem to your future self. For non-residents and foreign buyers, the path is narrower anyway—age, residency status, and income documentation are scrutinized more strictly.A more reliable approach is to lock terms at the moment of signing:First, confirm which lender is specified in the loan contingency, the loan amount to be applied for, and the approval deadline—the trio is non-negotiable.Second, if it’s a custom build, confirm that the land and building contracts include cross-termination and that their contingency deadlines are aligned.Third, confirm how “insufficient approval amount” will be handled—what approval percentage triggers the clause, and whether rescission is full or adjusted pro rata.Fourth, run a rate stress test between pre-approval (事前審査) and final funding: if rates rise another 0.5 percentage points, do your monthly payment and household cash flow still hold?The rate environment will keep moving—no one controls that variable. But contract terms are negotiable before you sign, and they determine whether a rate shift costs you several million yen in default penalties or becomes a “glad we wrote that in.” Before wiring your earnest money, use Urbalytics’ area yield and rent benchmark tools to compare real local numbers with the assumptions in your contract—the gaps are often your negotiation starting points.Note: Illustrative images in this article were generated by AI.#JapanRealEstate #Mortgage #Flat35 #RisingRates #LoanContingency #CustomBuiltHome #BuyingInTokyo #TokyoMetroArea #GrossYield #RealEstateContracts #ForeignBuyers #MortgageRates #JapanPropertyInvestment #UrbalyticsReferences田上嘉一, “If mortgage rates rise, can you cancel the contract? The loan contingency to watch in custom homebuilding,” Yahoo! News Expert, October 6, 2026, https://news.yahoo.co.jp/expert/articles/e828c9ab4825e1c2cfc45762d96fce6ef1027645Jiji Press, “Newsword: Ultra-long-term mortgages,” Yahoo! News, October 7, 2026, https://news.yahoo.co.jp/articles/9179d81c8c76b33c5ceac0adaca53e4ef0d3af45SUUMO Journal(山本久美子), “Over half of people in their 20s use generative AI to search for homes—how is purchase intent changing as rates rise?”, Yahoo! News, October 7, 2026, https://news.yahoo.co.jp/articles/7dcce0b7cd9d4a3eb46c2e7369809c152b1b3f25全国宅地建物取引業協会連合会・全国宅地建物取引業保証協会, “2026 Housing and Residential White Paper,” 2026, https://www.zentaku.or.jp/Japan Housing Finance Agency, “Flat 35 | Interest rate trends,” 2026, https://www.flat35.com/kinri/index.phpReal Estate Transaction Improvement Organization (RETIO), “Explanation of loan contingency clauses,” https://www.retio.or.jp/Urbalytics internal platform data (building_cap_rate_stats / rent_stats, retrieved October 7, 2026), https://www.urbalytics.jp/
Non-residents can finance property in Japan—the hurdle sits in the "annual income" line

Non-residents can finance property in Japan—the hurdle sits in the "annual income" line

Some Japanese banks do lend to non-residents, but the JPY 10 million annual income line keeps most people from even picking up the phone.An interview with a banker cracked open a door we usually can’t seeOn October 6, Weekly Economist Online published an interview with Tokyo Star Bank president Takeshi Ito. The protagonists are Taiwanese clients and TSMC Kumamoto expatriates—seemingly unrelated to most Chinese-speaking readers looking to buy property.But one line is worth reading twice: as early as 2014 the bank developed a real estate loan called "Tokyo Shofukusei," under which "non-residents may, subject to prescribed screening, use financing needed to purchase real estate in Japan."For readers who have long asked on social media whether they can borrow without being in Japan, this is one of the few explicit answers from a bank chief. In the same interview, Ito also spelled out the hard part: for foreign nationals with no address or actual residence in Japan, even opening a basic bank account is difficult under the Foreign Exchange and Foreign Trade Act.This point is often glossed over by agents. Under anti-money-laundering rules, strict KYC isn’t banks being difficult—it’s the system’s first gate for remote owners. Borrowing is only the second gate beyond it.Tokyo Star’s ability to do this isn’t because it is aggressive; it’s because since 2014 it has been a subsidiary of Taiwan’s CTBC Bank. The parent’s client relationships, Chinese-speaking staff, and dedicated hotlines for Taiwan and Hong Kong form the entire infrastructure behind this product.Concept image of a low-rise residential street in Tokyo"Tokyo Shofukusei" itemized: Taiwan JPY 10m, Hong Kong JPY 15mThe bank’s website states the conditions plainly, leaving virtually no ambiguity—unusual for Japanese financial product pages.The version for Taiwan residents requires: holding a Republic of China (Taiwan) passport, residing in Taiwan, being a Taiwan tax resident and not a resident of any other country or region, and submitting publicly verifiable income documents. Applicants must be at least 20 at application and no older than 75 at final repayment.The real dividing line is in the income row: the prior year’s official income certificate must show annual income of at least JPY 10 million, or net assets of at least JPY 30 million. The net-asset formula is specified: financial assets in Japan and Taiwan plus real estate held in Japan, minus housing-related debt, converted to JPY at the application-date exchange rate.The Hong Kong version sets a higher bar: hold a Hong Kong ID (PIC or IC), have primary income sourced in Hong Kong, the maximum age at final repayment tightened to 65, and the threshold raised to annual income of JPY 15 million or net assets of JPY 45 million. The gap broadly reflects the bank’s different assessments of how verifiable income and assets are in the two markets.The rest of the terms aren’t friendly to remote holders:First, you must appear in person at Tokyo Star Bank’s head-office counter to sign. Applications can be mailed or emailed as PDFs, but the last step still requires a trip to Tokyo—a hard cost for buyers who want to transact remotely.Second, if the purpose is investment, rent must be remitted into the bank’s designated repayment account—binding rental cash flows to the same bank. Changing the property manager or bank later will require renegotiation.The loan term is 1–25 years, amounts start from JPY 20 million, and eligible collateral includes whole or sectional-title apartments, entire apartment buildings, single commercial buildings or sectional-title retail/office units, and detached houses—broader coverage than most expect.As for the rate, the website doesn’t publish it and lists only a Chinese-language hotline: the rate is undisclosed—you have to call. That fact itself is information: pricing is negotiated case by case, not posted.Concept image of a bank consultation counterResidents in Japan take another path: you can still get a home loan without permanent residencyAsking whether "foreigners can borrow in Japan" conflates two very different groups. The previous section covered people overseas buying investment properties; foreigners already living in Japan and buying a primary residence go through another channel—far more lenient.The same bank’s "Star Home Loan (for applicants without permanent residency)" draws the line here: as a regular employee, have worked in Japan continuously for 1+ years with pre-tax annual income of JPY 4 million or more; or annual income of JPY 3 million or more, be a regular employee and under 40 (subject to guarantee/underwriting assessment and other conditions). Company directors and the self-employed must have operated in Japan for at least three fiscal periods.The rate is the number to watch on this channel: with payroll to a designated account and a full-term 1.10% discount, the floating rate is 2.400%–3.500% p.a. (as of October 1, 2026). No guarantee fee, zero prepayment fee, term up to 35 years, amount JPY 5 million to JPY 100 million.The trade-off is on the same page: on drawdown you pay a handling fee of 2.2%–3.3% (incl. tax) of the loan amount, plus registration fees and stamp duty; group credit life insurance may add up to 0.3% p.a. depending on the plan. If you have a spouse, the spouse must be a joint and several co-borrower or joint guarantor.Add that up: on a JPY 50 million loan, you’ll pay JPY 1.1–1.65 million in fees upfront—costs not reflected in the interest rate but which materially shift early-years holding costs.Note the final remark: if you obtain permanent residency during repayment and notify the bank, after review your rate may be lowered. In other words, a change in status is an opportunity to negotiate a rate cut—many people forget after getting PR.3.5% rate versus 4.4% gross yield: where does the math break even?Put financing terms and asset yields on the same chart and you’ll see "can borrow" and "worth borrowing" are different questions.Urbalytics compiled listings of whole-building income properties from July 2025 to October 2026 (gross yield = advertised annual income ÷ asking price; duplicates merged, outliers removed): median 4.65% around Ikebukuro (88 buildings), 4.44% around Kinshicho (42), 5.03% around Kamata (61), and 6.09% around Kawasaki (60).We use medians rather than averages. Ikebukuro’s average is lifted to 5.24% by a few high-yield listings and doesn’t represent a typical asset—this statistical trap is common in broker materials.Taking the upper end 3.500% from the home-loan floating-rate band in the prior section as an optimistic reference, Ikebukuro’s spread is only about 1.15 percentage points; Kinshicho is narrower at about 0.94 points. Kamata is about 1.53 points, while Kawasaki offers roughly 2.59 points.Gross-yield distributions for whole-building income properties at four key Greater Tokyo stations vs mortgage-rate band (Data: Urbalytics)Urbalytics Insight What this comparison really shows is that in core station areas like Ikebukuro and Kinshicho, the spread between advertised gross yield and borrowing cost is down to roughly one percentage point. After fixed-asset and city-planning taxes, management fees, and vacancy, leverage delivers little to no excess return. Urbalytics’ station-area whole-building yield distribution tool lets you check this spread by station—instead of deciding off the phrase "central Tokyo."Risk warning The above spreads use the upper bound of an owner-occupied home-loan rate as a best-case floor. "Tokyo Shofukusei" is an investment loan with undisclosed pricing, and investment financing is typically more expensive; add the 2.2%–3.3% arrangement fee and FX volatility, and the actual spread may be even narrower—or negative. Also, these yields are based on asking prices, not achieved prices.Conclusion: decide which bucket you’re in before booking viewingsThe value of this news isn’t that "Japan has loosened"—the terms have been there since 2014. Its value is turning a sheet of conditions once shared only by brokers into a public checklist you can verify line by line.For readers overseas, the practical move is to first test yourself against the income and net-asset lines, and then factor the trip to the Tokyo head office into your costs. If you can’t clear either line, paying cash—or applying via a family member already residing in Japan—will often save more time than searching for "a bank willing to lend."Concept image of rental apartment blocks near TokyoFor readers already working in Japan, the picture is far brighter: one year of continuous employment and JPY 4 million in income is within reach for many, and after you obtain permanent residency you still have a chance to negotiate a lower rate.Note that this article unpacks only one bank’s products. Different institutions treat non-residents and non-PR applicants very differently, and conditions will move with the rate environment—don’t treat these numbers as market-wide rules.As for where to buy—that’s a separate question. In a market where the spread has been squeezed to about one percentage point, choosing the wrong station area costs more than choosing the wrong bank. Urbalytics’ station-level yield and price-per-tsubo data are designed to remove the guesswork from that step.※ The concept images in this article were generated by AI.#JapanRealEstate #NonResidentLoans #ForeignHomeLoans #TokyoStarBank #TokyoShofukusei #PermanentResidency #Mortgage #WholeBuildingIncome #GrossYield #Ikebukuro #Kinshicho #Kawasaki #TokyoProperty #JapanMortgage #UrbalyticsReferencesSunday Mainichi × Weekly Economist Online, 2026, "Interview: 'Strengthening services for Taiwanese; supporting TSMC Kumamoto expatriates and their families' — Takeshi Ito, President, Tokyo Star Bank", https://news.yahoo.co.jp/articles/ff3dd22bc8686ca7f0db91c26f725376fbd69fdbTokyo Star Bank, 2026, "Tokyo Shofukusei" Star Real Estate Investment Loan (For Non-Residents of Japan), https://www.tokyostarbank.co.jp/foreign/products/loan/property/Tokyo Star Bank, 2026, Star Home Loan (For Applicants Without Permanent Residency), https://www.tokyostarbank.co.jp/foreign/products/loan/homeloan_star/Urbalytics, 2026, Whole-Building Income Properties Gross Yield Statistics (Ikebukuro, Kinshicho, Kamata, Kawasaki; July 2025–October 2026), https://www.urbalytics.jp/market
The “Invisible Housing Cost” of ¥32,000 per Month: Greater Tokyo resale condos are starting to stratify by “can you afford to hold?”

The “Invisible Housing Cost” of ¥32,000 per Month: Greater Tokyo resale condos are starting to stratify by “can you afford to hold?”

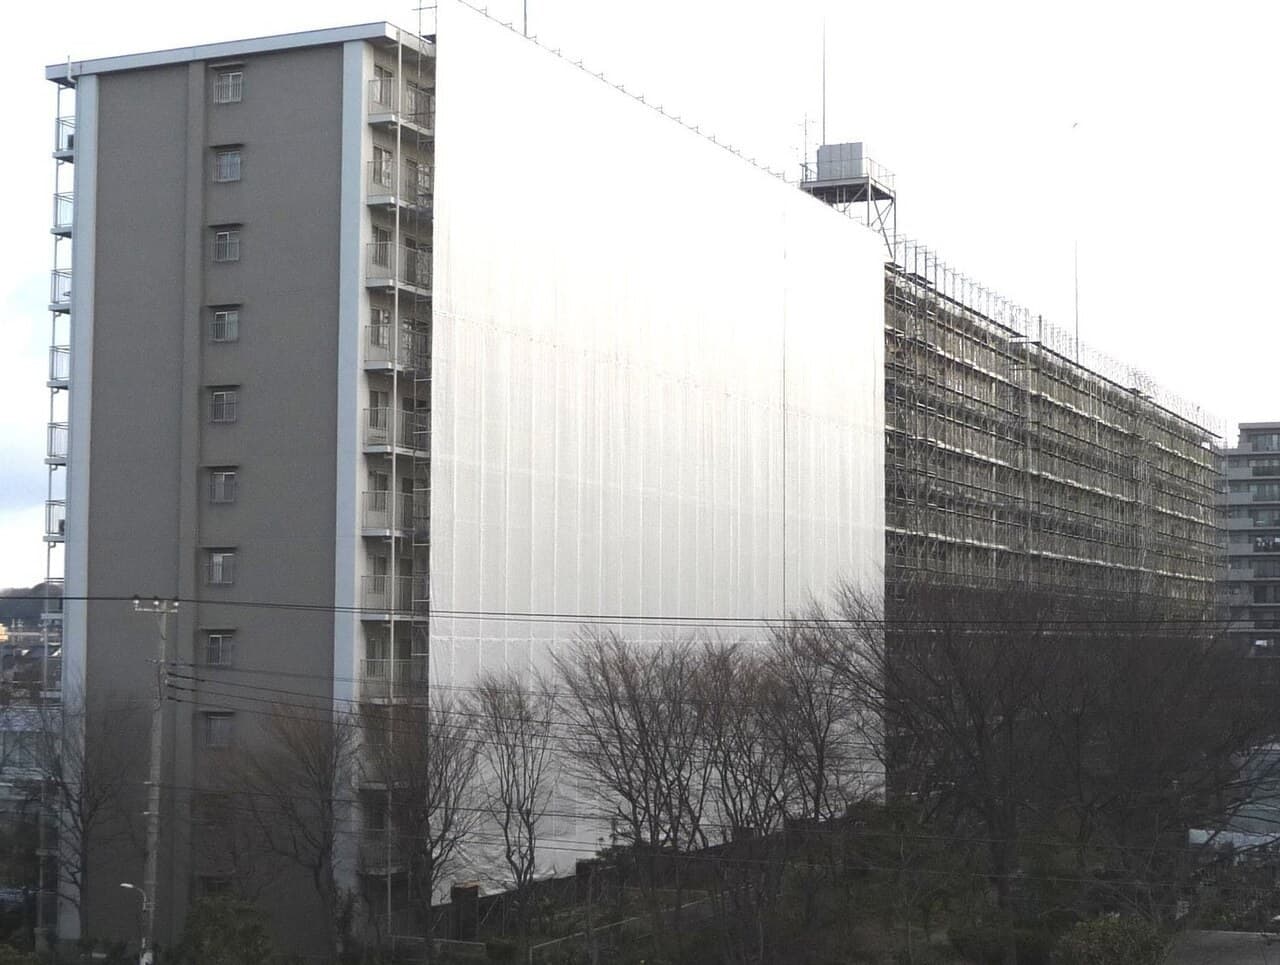
The same management fee plus repair reserve fund takes just 8.5% of rent in Nakano, but nearly one-fifth in Omiya and Funabashi; holding costs are reshuffling how resale condos are valued.In recent years, when judging whether a Tokyo resale condo is worth buying, investors mostly looked at distance to the station, building age, floor area, and developer brand. But a figure often tucked onto the last page of the purchase contract is quietly becoming part of the pricing equation.On October 2, 2026, Kenbiya ran an analysis titled “Condo prices won’t fall,” arguing that the coming market may not broadly decline; instead, assets will be screened by “how much they cost to hold.” Building on that piece, we pulled Tokyo Kantei’s original releases and used the Urbalytics platform to fetch rents for six stations across Greater Tokyo to answer a more concrete question: with the same holding cost, how much does the burden differ across rental condos in different areas?I. A turning point has appeared, but it’s not a “broad-based decline”First, the big picture. According to Tokyo Kantei’s September 24 release, the average asking price in August 2026 for a 70 m² used condo in Tokyo’s 23 wards was ¥126.77 million, down 0.4% m/m—its third straight monthly drop. Tokyo Metropolis overall was ¥112.74 million, edging down 0.2% m/m, the first decline in 28 months.But in the same dataset, Greater Tokyo as a whole rose 0.8% m/m to ¥76.06 million, up for 25 consecutive months. The drivers were the three neighboring prefectures: Saitama rose 1.4% m/m to ¥33.29 million and Kanagawa rose 0.7% to ¥44.00 million, with both up more than 10% y/y.In other words, buyers are starting to balk at core-area prices, while the suburbs still absorb displaced demand. New-builds show similar signals: citing Tokyo Kantei, Kenbiya notes Greater Tokyo’s new-condo price per tsubo fell from ¥5.021 million in Q1 2026 to ¥4.813 million in Q2, down 4.1%.However, new-build prices have limited room to fall. With materials, labor, and energy costs not retreating, developers are more likely to shrink unit sizes, shift supply to the suburbs, and pace launches to sustain unit prices rather than cutting list prices. With new-build prices propped up by costs, the resale market will keep absorbing “can’t afford new” demand—the question is which types of resales that demand will chase.A condo under major renovation with scaffolding erected on the exteriorII. ¥32,000 per month: rising slower than you think—and more stubborn than you thinkTokyo Kantei’s statistics show that for a newly built condo in Greater Tokyo (70 m² basis) in 2025, the monthly management fee averaged ¥21,691 and the repair reserve fund (修繕積立金) averaged ¥10,148, for a total of ¥31,839—about ¥380,000 per year—up roughly 41% from ¥22,574 in 2016.Notably, management-fee growth has lagged home-price growth. Using 2000=100, the 2025 index for management fees is 179.5 and for the repair reserve 193.3, while the per-tsubo price index has reached 249.9. Another Tokyo Kantei report on July 30 also notes the per-m² management fee in Greater Tokyo rose from ¥247.1 in 2010 to ¥310.4 in 2025, a 25.6% increase—well below home-price gains over the same period.This means holding costs have been relatively “suppressed” versus prices over the past decade-plus. But that scissors gap is narrowing: tracking condos completed in 2010, Tokyo Kantei finds that in Tokyo, among properties sold by major developers, in the last five years 11.8% have seen per-m² management fees rise more than 10% from completion, and 15.3% have risen more than 5%.Pressure is greater on the repair side. According to data cited by Kenbiya, the one-time initial repair reserve contribution (修繕積立基金) paid when buying a new-build reached ¥879,324 in 2025, up for 11 straight years. For 15-year-old resale condos, the combined monthly management fee plus repair reserve averages ¥34,509—higher than for new-builds—with the reserve alone at ¥17,180.Trend in holding costs for newly built condos in Greater Tokyo, and holding costs as a share of rent by stationIII. Urbalytics data: the same cost weighs more than twice as much depending on the stationFor owner-occupiers, the management fee is a living expense; for rental investors, it’s a fixed cost that comes straight out of rent. To make this clear, we used Urbalytics to compute the 12‑month median monthly rent per m² for 50–80 m² rental condos within a 15‑minute walk of six stations.The results: Nakano ¥5,336 (n=194); Sangenjaya (三軒茶屋) ¥4,220 (n=117); Musashi-Kosugi (武蔵小杉) ¥4,023 (n=67); Hachioji ¥2,845 (n=131); Omiya (大宮) ¥2,429 (n=176); Funabashi (船橋) ¥2,369 (n=50).Applying the Greater Tokyo new-build average holding cost—about ¥455 per m² per month—uniformly to these six stations, the share of rent taken by management fees plus the repair reserve is just 8.5% in Nakano, 10.8% in Sangenjaya, and 11.3% in Musashi-Kosugi; it rises to 16.0% in Hachioji, and to 18.7% and 19.2% in Omiya and Funabashi, respectively. Using the 15-year-old cost level, Omiya and Funabashi exceed 20%.On yields, the difference is even clearer. A condo with a 6% gross yield that loses 20% of rent to holding costs nets roughly 4.8%; the same absolute costs at a high-rent, core-area station take less than 10% of rent, so even a 4% gross yield retains about 3.66%.Urbalytics Insight Management fees and repair reserves vary little across areas, but rents can differ by over 2x. The same “holding cost” therefore erodes suburban rental returns at roughly twice the rate it does in the urban core.Note that the above uses Greater Tokyo averages. Actual management fees vary by property scale, amenities, and management company; suburban assets also tend to have slightly lower fee rates per m².More granular area data are available in the Nakano Ward resale condo market report and the Saitama City Omiya Ward resale condo market report.Large condominium complexes around Omiya StationIV. The real dividing line: the owners’ association “ledger”If rent levels determine the relative weight of holding costs, the trajectory of those costs is determined by the finances of each building’s owners’ association (管理組合). Kenbiya calls this the “fifth pricing factor” after distance to station, building age, size, and brand.The logic is straightforward. Many long-term repair plans (長期修繕計画) drawn up a decade ago were costed at then-prevailing construction prices; MLIT’s reference range for major-repair (大規模修繕) work is ¥1–2.5 million per unit, while materials and labor are still rising. When reserves fall short, an association has only three options:First, raise the monthly repair reserve contribution. This directly lifts holding costs—permanently shaving off rental income for landlords.Second, narrow the scope of work. That saves money on paper but lowers maintenance standards, which ultimately shows up in leasing competitiveness and resale price.Third, levy a one-time special assessment on owners. This is especially unfriendly to overseas investors holding remotely, often surfacing as a sudden cash outlay years after purchase.So a low reserve level isn’t a virtue in itself. Buildings that keep reserves artificially low—kicking the can down the road—may look cheap to hold today but are likely to face steep hikes or special assessments later. By contrast, buildings that steadily, planfully increase reserves tend to carry less future uncertainty.Tower condos feel this pressure more acutely; we analyzed this in The repair-reserve exit problem of Greater Tokyo tower condos.Tokyo Kantei also notes another trend: some 2010‑vintage condos have cut per‑m² management fees by about 30% by switching management companies. This shows management costs aren’t entirely fixed, but the service trims that follow are something investors need to vet before buying.Risk note Kenbiya’s example is clear: two resale condos priced at ¥50 million—one with ¥25,000 per month in holding costs, the other ¥45,000—diverge by ¥4.8 million over 20 years. If the latter also faces planned reserve hikes, the true burden gap only widens.Tower condo cluster in Musashi-KosugiV. Takeaway for investors: shift from “can I buy it” to “can I carry it”Taken together, the base case for the next few years is unlikely to be a condo price collapse, but rather high new-build pricing and a polarized resale market. Buildings close to stations, well managed, with pragmatic repair plans will keep attracting demand spilling over from the new-build market; older buildings with underfunded reserves and burdens like mechanical parking systems or costly equipment may need to discount to find buyers.Interest rates add another layer. Kenbiya reports Japan’s 10-year JGB yield has topped 3%; per Diamond Real Estate Research Institute, variable, 10-year fixed, and 35-year fixed mortgage rates at major banks all rose in October, with Flat 35 (purchase type) at 3.830%. For leveraged investors, with prices, rates, and holding costs all up, the cushion in net returns is thinning.For investors assessing Greater Tokyo resale condos, we recommend putting the following three items on the same sheet as the asking price:First, from the Important Matters Investigation Report (重要事項調査報告書): the repair reserve balance, delinquency status, and recent increase history.Second, the year the long-term repair plan was formulated and the timing of the next major overhaul; the older the plan, the more you should assume higher costs.Third, the station’s median rent; use it to compute holding costs as a share of rent. The higher that ratio, the more “illusory” the gross yield.We have previously analyzed Tokyo’s policy signals to curb condo speculation and record-high studio rents in the 23 wards.Those covered the buy side and the rent side; this piece fills in the holding side. Only all three together give the true return of a resale condo.If you want to quickly compare rental levels and yields by station, you can filter by station and size band on the Urbalytics platform. Run the “can I afford to hold it” math first, then talk price.Tags#Japan Real Estate #Tokyo Resale Condos #Management Fee #Repair Reserve Fund #Long-Term Repair Plan #Holding Costs #Greater Tokyo Condos #Rental Returns #Gross Yield #Nakano #Omiya #Funabashi #Tokyo Kantei #Japan Property Investment #UrbalyticsReferencesKenbiya, 2026, “Condo prices won’t fall—In an era when asset value is selected by ‘how much it costs to keep holding,’” https://www.kenbiya.com/ar/ns/buy_sell/property_choose/10570.htmlTokyo Kantei, 2026, “Three Major Metropolitan Areas/Major Cities: Monthly price trends for 70 m² used condos, August 2026,” https://www.kantei.ne.jp/report/70m2/9447/Tokyo Kantei, 2026, “Kantei eye 127: Greater Tokyo—Ranking of management companies for new/used condos; Changes in condominium management fees,” https://www.kantei.ne.jp/report/kantei-eye-special/9232/Tokyo Kantei, 2026, “Changes in condominium management fees in Greater Tokyo,” https://www.kantei.ne.jp/wp-content/uploads/127TR_kanrihi.pdfDiamond Real Estate Research Institute (via Yahoo! News), 2026, “How did mortgage rates move in October?” https://news.yahoo.co.jp/articles/04909539f582491c57710f97274f39ffbed32ad9Kenbiya, 2026, “The J-REIT market is slumping—is this the buying opportunity? With Japan’s 10-year yield above 3%, considering the future of J-REITs,” https://www.kenbiya.com/ar/ns/jiji/reit/10580.htmlWikimedia Commons, “Condominium in maintenance.jpg” (CC BY-SA 3.0) / “Central Suite Omiya-Sakuragicho.jpg” (CC BY-SA 4.0) / “Musashi-Kosugi tower blocks, Kawasaki” (CC BY-SA 3.0), https://commons.wikimedia.org/
Japan Mortgage Rates Hit Record High: Flat35 Breaks 3.46%, Tokyo Investment Spread Narrows to Critical

Japan Mortgage Rates Hit Record High: Flat35 Breaks 3.46%, Tokyo Investment Spread Narrows to Critical

Japan Mortgage Rates Hit Record High: Flat35 Breaks 3.46%, Tokyo Investment Spread Narrows to Critical body { font-family: "Hiragino Sans", "Noto Sans JP", "Microsoft YaHei", sans-serif; line-height: 1.8; color: #1a1a1a; max-width: 720px; margin: 0 auto; padding: 20px; } h1 { font-size: 1.6em; color: #0f4c5c; border-bottom: 3px solid #0f4c5c; padding-bottom: 10px; margin-top: 1.5em; } h2 { font-size: 1.3em; color: #0f4c5c; border-left: 4px solid #e36414; padding-left: 12px; margin-top: 2em; } h3 { font-size: 1.1em; color: #2a6e7c; margin-top: 1.5em; } p { margin: 0.8em 0; } strong { color: #e36414; } img { max-width: 100%; height: auto; border-radius: 8px; margin: 1em 0; display: block; } figcaption, .img-caption { font-size: 0.85em; color: #666; text-align: center; margin-top: -0.5em; margin-bottom: 1em; } table { border-collapse: collapse; width: 100%; margin: 1em 0; } th, td { border: 1px solid #ddd; padding: 8px 12px; text-align: left; } th { background-color: #0f4c5c; color: white; } tr:nth-child(even) { background-color: #f8f8f8; } blockquote { border-left: 4px solid #e36414; margin: 1em 0; padding: 0.5em 1em; background-color: #fff5eb; color: #555; } a { color: #0f4c5c; text-decoration: underline; } code { background-color: #f4f4f4; padding: 2px 6px; border-radius: 4px; font-size: 0.9em; } Japan Mortgage Rates Hit Record High: Flat35 Breaks 3.46%, Tokyo Investment Spread Narrows to Critical Three Unusual Signals in September's Mortgage Data The September 2026 mortgage market released three unusual signals. First, on September 1, the 10-year Japanese government bond yield briefly touched 3.000%—the first time in roughly 30 years. Second, Flat35 (loan term 21-35 years, LTV at or below 90%, new JHF group credit insurance) recorded its most frequent September rate at 3.460% per annum, up 0.170 percentage points from August's 3.290%—a second consecutive monthly rise and the highest level since the methodology change in October 2017. Third, MUFG Bank and Sumitomo Mitsui Banking Corporation raised their preferred variable mortgage rates to 1.195% and 1.525% respectively, both up 0.25 percentage points, while Mizuho, Resona, and Sumitomo Mitsui Trust held their rates steady in the 0.950%-1.080% range. The simultaneous appearance of these three numbers means it is now absorbing two pressures at once: "rising long-term rates on the fixed side" and "policy rate normalization transmitting to the retail side on the variable side." The drivers behind each are different. Long-term rates track the 10-year JGB yield, pricing future inflation and fiscal conditions. Variable rates follow the short-term prime rate, reflecting the pace of monetary policy normalization feeding into retail pricing. The September 18 BoJ rate hike from 1.0% to 1.25% belongs to the second category, while the September 1 long-term bond yield at 3.000% belongs to the first. What Monthly Payments Actually Look Like To put the choice's impact on household leverage in concrete numbers: on a 40 million yen loan, 35-year equal-payment-amortization schedule, the September variable preferred rate of 1.195% gives a monthly payment of around 117,000 yen. Locking in Flat35 at 3.460% pushes that to about 164,000 yen—an extra 37,000 yen per month, or 444,000 yen per year. This is the "certainty premium" between variable and fixed. Before long-term yields broke above 2%, the premium was modest. Now it has widened to a level that ordinary households cannot ignore. Flat35 conditions show that the rate climbs to 3.570% when LTV exceeds 90%, and the Flat50 (terms of 36-50 years) reaches 3.700%. Both indicate that the higher the down payment, the lower the cost of fixing the rate at the edge. Does the Yield Spread Still Exist? The transmission of rising rates to real estate investors depends on the income side of the equation—the cap rate (annual net income divided by asset price). urbalytics's station-level cap rate statistics (latest September 2026) show that median cap rates at major Tokyo hubs display a clear gradient: Shinjuku 4.30% (31 samples), Shibuya 3.63% (57 samples), Shinagawa 2.73% (4 samples). Placing Flat35's 3.46% on the same chart reveals an interesting phenomenon. The 0.84 percentage point positive spread between Shinjuku's 4.30% and Flat35's 3.46% means that even fully financed with Flat35, the median Shinjuku asset can still generate positive returns on paper. The 0.17 percentage point spread between Shibuya's 3.63% and Flat35's 3.46% is critical—almost exactly at the boundary. Meanwhile, Shinagawa's 2.73% already sits below Flat35's 3.46%, meaning that financing a Shinagawa-area property with Flat35 would have on-paper income unable to cover the financing cost. This comparison requires three caveats. First, cap rate is gross yield before deducting management fees, repair reserves, fixed asset tax, and other holding costs. After deductions, net yield typically falls another 1 to 1.5 percentage points. Second, Shinagawa's sample size is only 4, statistically weaker than Shinjuku's 31 and Shibuya's 57. Third, the Flat35-cap rate comparison ignores principal repayment—cap rate measures cash flow income, while Flat35 monthly payments include both interest and principal. Variable vs Fixed: The Current Decision Framework In the current environment, the choice between variable and fixed needs to shift from "which number is lower" to "which number is more stable." Variable rates in September sit in the 1.195% (MUFG) to 1.525% (SMBC) range, having moved up overall from the 0.945%-1.275% range at the start of the year. The BoJ policy rate at 1.25% is now in effect, and the probability of further adjustment at upcoming policy meetings (there are several remaining in 2026) is not low. The Norinchukin Research Institute forecasts the policy rate to rise to 1.5% around June 2027. Choosing variable is therefore making a judgment call: how likely is the policy rate to rise another 25 to 50 basis points over the next 12 to 18 months? If you judge it "still rising," variable means the payment jumps from some point next year. If you judge "close to peak," the current low variable advantage can persist for a while longer. One change in September is that 2 of 5 major banks raised variable rates while 3 held steady—indicating pricing divergence among banks rather than uniform industry action. For buyers considering variable, this September episode shows that future variable rate hikes will not happen in lockstep across all institutions, but may continue in 2-of-3 batches. The fixed side follows a different logic. Flat35 at 3.46% is a historical high, primarily driven by the long-term JGB yield at the 3% level. If fiscal conditions ease and overseas tightening pace changes, the long-term yield could fall, taking Flat35 with it. But if inflation stays above 2% and fiscal expansion continues, long-term yields remain above 3% or rise further—locking in Flat35 now means locking in a relative low. Three Decision Rules for Now First, Flat35 is at a historical high. The next key indicator to watch is the 10-year JGB yield. This yield touched 2.900% in July 2026, fell to 2.685% in August, broke through 3.000% again on September 1, and closed at 2.990% on September 17. If October stays below 3%, Flat35 will likely see a small pullback. If it continues upward, Flat35 will follow. Second, the core question for variable rate choice is "can the household income absorb the payment after a rate hike?" For the September variable rate of 1.195% rising to 2.0% (hypothetical): on a 40 million yen, 35-year loan, monthly payments rise from 117,000 yen to 132,000 yen, an increase of 15,000 yen per month. Whether you can absorb that is the core question. Third, the granularity of cap rate data matters more than the Flat35 number itself. The nearly 1 percentage point gap between Shinagawa's 2.73% and Shibuya's 3.63% determines whether the investment side still has room in a rising-rate environment. Using urbalytics's cap rate statistics, you can break this down by station, building type, and year. The cap rate gradient by sample year at Shibuya Station and Shinjuku Station also differs from each other. One-Sentence Judgment The combination of September Flat35 at 3.46% and variable rates at 1.195%-1.525% means that real estate investors are facing a dual environment of "rate costs at decade highs, with cap rates varying by location." In areas where the Flat35-nominal spread is near zero or negative (like Shinagawa), prioritize variable financing while preparing for payment volatility. In areas where the positive spread is still thick (like Shinjuku), whether to lock Flat35 depends on the view of long-term JGB yield direction. Station-level cap rate data is the starting point for this judgment. urbalytics station-level data is the tool for tracking these indicator changes. Data sources: housingloan-navi "住宅ローン金利の動向と見通し【2026年9月】" (updated September 26, 2026), housingloan.jp "住宅ローンの金利動向(2026年9月更新)", Sumamoge "【2026年9月】住宅ローン金利はいくら?" (published September 2026), urbalytics.jp rent_stats and building_cap_rate_stats (latest September 2026 samples). This article does not constitute investment advice.
Studio Rents in Tokyo’s 23 Wards Break Through ¥114,000: Behind the New High, Demand Is Spilling Over to Kanagawa, Saitama, and Outer Tokyo

Studio Rents in Tokyo’s 23 Wards Break Through ¥114,000: Behind the New High, Demand Is Spilling Over to Kanagawa, Saitama, and Outer Tokyo

Studio rents in the 23 wards hit a new high of ¥114,000, but faster growth is occurring in outer Tokyo and neighboring prefectures. Rental inflation across Greater Tokyo has shifted from the urban core to the periphery.On September 28, the real estate information site アットホーム (At Home) released rental data for August 2026 covering the Greater Tokyo area. In Tokyo’s 23 wards, the average asking rent for studios under 30 m² reached ¥114,339, up 10.0% year over year, the highest since the series began in January 2015.Coverage the same day also highlighted two other numbers: studios in Kanagawa Prefecture at ¥82,600, up 11.8% y/y; and Saitama Prefecture at ¥72,600, up 10.9%—both record highs.At a glance, this looks like yet another “Tokyo rents are too high” headline. But a closer read of At Home’s original report shows what investors should focus on this time: the distribution of growth has changed.1) The numbers: all four size bands in the 23 wards set new recordsAt Home measures “rent + management/common fees” and segments units by size into four bands: studios (In August 2026, rental condominiums across the 23 wards set new highs since 2015 in all four bands. Couples units averaged ¥185,268, marking a 15th consecutive record; family units ¥263,469; large units ¥423,559.On an index with January 2015 = 100, studio rents in the 23 wards have reached 140.4. In other words, the same compact unit now asks about 40% more than eleven years ago, with nearly one-third of that gain concentrated in the past 12 months.This indicates the rent upcycle is broad-based, spanning studios through large formats—not confined to any one unit type.Mid- and low-rise apartments on a residential street in Shinjuku. Studio rents in the 23 wards have been the bellwether in this upcycle.2) Month-on-month lens: studio rent momentum in the 23 wards is easingThere’s an easy-to-miss detail. In July, studio rents in the 23 wards saw their first m/m decline in 26 months. August rebounded, but only by 0.2% m/m—just ¥192.By contrast, in August large units rose 1.7% m/m and family units 1.4% m/m. Smaller units appear near tenant affordability ceilings, slowing their ascent; larger formats continue to catch up.At Home’s analysis reaches a similar conclusion: core-area rents remain elevated, with some demand shifting to surrounding areas and lifting overall levels. Growth rates are narrowing, but a high plateau is likely to persist.For investors focused on small units in the 23 wards, this means the room to absorb high entry prices via rent growth is narrowing. The “pay up now, let rents catch up” playbook of the past two years now calls for more conservative underwriting.3) The faster lane is outside the core: outer Tokyo, Kanagawa, SaitamaThe real acceleration is beyond the 23 wards. By At Home’s y/y rankings for studios, two of the national top three are in Greater Tokyo: outer Tokyo at +11.9% and Kanagawa at +11.8%—both outpacing the 23 wards’ +10.0%.The pattern is even clearer for couples and family units. In outer Tokyo, couples units rose 13.7% y/y, the highest among 13 surveyed regions; family units gained 10.2%, also No. 1. In Chiba Prefecture, family units ranked third at 9.3%.By comparison, family units in the 23 wards rose only 6.5% y/y. Core-city families are trading space against budget, pushing demand to the outer commuter belt.The implication is clear: a “high-plateau phase” in the 23 wards is coinciding with an “acceleration phase” in the periphery. The main battleground for rent growth is shifting from inside the Yamanote Line to core stations 30–60 minutes out.Station-front district around Kawasaki Station’s east exit. Kawasaki is one of Kanagawa’s key commuter hubs.4) Urbalytics data: rent gaps and cap-rate gaps are not symmetricalTo map At Home’s area averages to specific stations, we used Urbalytics listings for rentals and whole-building income properties to compare four representative station areas: Shinjuku (23 wards), Tachikawa (outer Tokyo), Kawasaki (Kanagawa), and Omiya (Saitama).For rentals under 30 m², the median asking rent per m² was ¥5,431 around Shinjuku Station (n=115), ¥3,992 in Kawasaki (n=500+), ¥3,286 in Omiya (n=267), and ¥3,267 in Tachikawa (n=300).At the same stations, the median listed cap rate for whole-building income properties was 4.30% in Shinjuku (n=31), 6.05% in Tachikawa (n=95), and 6.30% in both Kawasaki and Omiya (n=123, n=99).YoY rent growth for studios, rent per m², and cap rates for whole-building assets across the four station areas.Urbalytics Insight Studio rent per m² in Shinjuku is roughly 1.65x Omiya’s, yet whole-building cap rates are a full 2 percentage points lower. Outer-core stations are seeing faster rent growth and higher cap rates—pricing has not fully reflected this spillover demand.Note that listings reflect asking, not achieved, prices; and Shinjuku’s whole-building samples include many commercial-use properties. Use these for direction, not precision pricing.Explore rent distributions by area in Urbalytics’ Kawasaki Ward Rental Condominium Market Report, Omiya Ward Rental Condominium Market Report, and Tachikawa City Rental Condominium Market Report. As a core-area benchmark, see the Shinjuku Ward Rental Condominium Market Report.Along Saitama Prefectural Route 90 toward Omiya Station. Omiya is Saitama’s transport and commercial hub.5) What this means for investorsA record-high rent is not, by itself, a buy signal; what matters is where it is happening and at what slope. Three takeaways from this data:First, small units in the 23 wards are entering a “high-level flattening” phase. Rents are unlikely to fall, but the odds of continued double-digit growth are diminishing. When buying at today’s cap rates, stress-test for flat to slightly lower rents.Second, core outer stations are in a “catch-up” phase. Commuter hubs such as Kawasaki, Omiya, and Tachikawa are seeing faster rent growth than the 23 wards and cap rates roughly 200 bps higher—making them prime beneficiaries of the spillover.Third, product mix matters more than postcode. In outer Tokyo and neighboring prefectures, couples and family units are leading—signaling that the migrating demand is budgeted households needing more space, not just students chasing cheaper studios.Risk reminders Higher cap rates in the periphery come with higher vacancy and repair risk. If core-city rents peak and demand recedes, older small units in the suburbs may be first to come under pressure. Before buying, verify supply pipelines and net in-migration station by station.From a longer vantage point, Greater Tokyo’s rent upcycle has already run for more than two years. As core-area rents near ceilings, the periphery’s relative value stands out, and this diffusion dynamic is likely to persist for a while.For cross-border investors, rather than chase small units in the 23 wards where cap rates have been compressed to just over 4%, widen the lens to core stations within a one-hour commute and compare, one by one, rent growth, cap rates, and liquidity.For how rent volatility impacts short-stay versus long-term returns, see our earlier analysis: Shinjuku Minpaku Regulation and the Divergence Within Tokyo’s 23 Wards.#TokyoRents #Tokyo23Wards #StudioApartments #JapanRentGrowth #RentalCondominiums #KanagawaRealEstate #SaitamaRealEstate #Kawasaki #Omiya #Tachikawa #CapRate #JapanRealEstateInvestment #GreaterTokyoRentalMarket #AtHome #UrbalyticsSourcesAt Home Co., Ltd., “Asking Rent Trends for ‘Rental Condominiums and Apartments’ in Major Cities Nationwide (August 2026)”, 2026, https://www.athome.co.jp/corporate/news/data/market/chintai-yachin-202608/At Home Co., Ltd., Press Release (PR TIMES), 2026, https://prtimes.jp/main/html/rd/p/000000770.000051123.htmlTBS NEWS DIG, “Average studio rent in Tokyo’s 23 wards hits a record ¥114,339 in August; Kanagawa and Saitama also rise over 10% y/y” (Yahoo! News), 2026, https://news.yahoo.co.jp/articles/7dbbfc6f432c741b66415fea5269d0ca9a40eb0fUrbalytics Market Report, Kawasaki Ward, Rental Condominiums, 2026, https://www.urbalytics.jp/market/area/kanagawa/kawasaki-ku/mansionUrbalytics Market Report, Omiya Ward, Rental Condominiums, 2026, https://www.urbalytics.jp/market/area/saitama/omiya-ku/mansionUrbalytics Market Report, Tachikawa City, Rental Condominiums, 2026, https://www.urbalytics.jp/market/area/tokyo/tachikawa-shi/mansionUrbalytics Market Report, Shinjuku Ward, Rental Condominiums, 2026, https://www.urbalytics.jp/market/area/tokyo/shinjuku-ku/mansion
Greater Tokyo Area Rents Hit a New High; Divergence Across Five Stations

Greater Tokyo Area Rents Hit a New High; Divergence Across Five Stations

Greater Tokyo Area Rents Hit a New High; Divergence Across Five StationsAccording to data released on September 16 by Tokyo Kantei (TOKYO KANTEI, a Japanese real estate research firm) on August 2026 rents for for-sale condominiums across the three major metropolitan areas, the Greater Tokyo Area’s average asking rent reached ¥4,242/㎡, up 0.8% m/m, the third consecutive monthly rise and the highest level in roughly a year. Tokyo Metropolis averaged ¥4,985/㎡—just shy of ¥5,000.Investment decisions in the capital region shouldn’t stop at prefectural averages. Using urbalytics’ rent_stats to drill the same prefecture and asset type down to the station level, five representative hub stations show clear divergence.I. Source data: Three of four prefectures hit a one-year highTokyo Kantei’s figures are based on asking rents for for-sale condominiums when leased, converted to per-㎡ terms, covering listings across major administrative areas in the Greater Tokyo Area (Tokyo, Kanagawa, Saitama, Chiba).August highlights:Greater Tokyo average: ¥4,242/㎡ (+0.8% m/m), up for three straight months, a near one-year high.Tokyo Metropolis: ¥4,985/㎡ (+0.4%), up for three straight months and just ¥15 below ¥5,000. High-priced samples in the core five wards (Chiyoda, Chuo, Minato, etc.) continue to support the average.Kanagawa: ¥2,910/㎡ (+0.6%), continuing to rise, a near one-year high.Saitama: ¥2,409/㎡ (+1.7%), the largest m/m increase, also a near one-year high.Chiba: ¥2,230/㎡ (-0.4%), down for five consecutive months. The driver is fewer newer units (completed within 7 years) among higher-rent wards in Chiba City.From the same monthly report one can read both “Greater Tokyo rents at a record” and “Chiba down five straight months.” The key is the level of granularity.Source: R.E.port 2026/9/16 “Greater Tokyo rents for for-sale condos hit the highest level in roughly a year” / original data by Tokyo Kantei, “Monthly trends in rents for for-sale condominiums across the three major metropolitan areas (Aug 2026).”II. urbalytics station-level data: Divergent trends and sample-size differences across five stationsBreaking Tokyo Kantei’s prefectural averages down to five representative hub stations on urbalytics, the past five quarters of unit rent per tsubo are as follows. Data: urbalytics rent_stats, property type = condominium, trendUnit = quarter, past one-year range. Note: 1 tsubo ≈ 3.3 ㎡.Station Sample size Unit rent per tsubo (1 year ago) Latest unit rent per tsubo Overall change Shibuya 500 ¥21,300 ¥21,100 -0.94% Shinjuku 168 ¥24,500 ¥17,700 -27.76% Shinagawa 333 ¥23,800 ¥19,000 -20.17% Yokohama 473 ¥16,100 ¥12,700 -21.12% Osaki 382 ¥19,600 ¥16,900 -13.78%“Latest” is 2026 Q3 (four-week rolling average through early September); “1 year ago” is the same period in 2025 Q3. Source: urbalytics rent_stats (property type = condominium, trendUnit = quarter, past one year).The most valuable information here is not only the rate of change, but also the sample size.Sample size reflects the number of listed rental condominiums at that station. A 500-unit Shibuya versus a 168-unit Shinjuku rests on very different statistical footing. Where samples are larger, outliers have less impact on the average and the series is more stable; where samples are small, averages swing more with individual listings.Shibuya is the most stable. Its 500-sample size is the largest among the five, and the -0.94% dip is statistically close to flat. This suggests Shibuya-area condo rents were broadly unchanged over the past year, broadly in line with Tokyo’s overall upward trend.Shinjuku has the fewest samples, just 168. With a small sample and shifts in listing mix across quarters, average moves can be amplified. The -27.76% in Shinjuku should be read alongside sample size: it does not mean rents truly fell by nearly one-third; rather, mix shifts drove volatility in the calculated average.Shinagawa (333) and Osaki (382) sit mid-pack in sample size and data reliability. Yokohama (473) is close to Shibuya in sample size, yet the -21.12% move remains large—evidence that the distribution of listing prices in Yokohama materially shifted over the past year.For investment decisions, the takeaway is straightforward: when selecting stations, sample size itself is a proxy for market depth. Stations with larger samples have deeper rental markets, better liquidity, and more reliable averages.III. Implications for investment decisions1. Shibuya is the most rent-stable among the five. A 500-sample and near-zero change indicate a stable demand structure. If you hold condos around Shibuya completed in or after 2015, you can raise your expectation for rent stability.2. Be extra cautious with change rates where sample sizes are small. Shinjuku’s 168 samples mean averages are sensitive to individual listings. In screening, don’t look only at change-rate rankings—use sample size as a second filter. Stations with stable sample sizes and small moves provide the most reliable signals.3. The Greater Tokyo market is in an upward rent trend. Tokyo Kantei’s prefectural averages have risen for three consecutive months, with three of four prefectures at near one-year highs. Station-level data don’t negate the trend—they show that beneath it, market depth and volatility differ by station. Picking stations matters more than timing.IV. Tracking this with urbalyticsurbalytics’ rent_stats provides quarterly trends at four levels—station, ward, city, prefecture—and supports slicing by property type (condo/single-family/with land), by floor-area band, and by completion-year band.Suggested monthly review workflow:First, check the target station’s sample size to judge whether the data foundation is stable.Then review the tsubo unit-rent change rate in conjunction with sample size. Stations with stable samples (>300 listings) and small moves (If a station shows unusually large changes, switch to finer cuts on urbalytics (by floor-area or completion-year band) to see whether a specific segment is pulling the overall average.The headline “Greater Tokyo hits a new high” may appear every month. What matters for investment is: which stations are driving that “high”? Is the sample size at your focus stations stable? Reading sample size and change rate together is far more reliable than looking at a single number.Data sources:1. R.E.port (2026/9/16) “Greater Tokyo for-sale condominium rents hit the highest level in roughly a year”: https://www.re-port.net/article/news/0000082907/2. urbalytics rent_stats (property type = condominium, trendUnit = quarter, past one year, five-station samples).3. Chart “Station-level condo unit rent per tsubo: five-station comparison in Greater Tokyo” generated with matplotlib based on the above urbalytics data.
03-4566-3208Contact