COLUMN
Tokyo real estate market trends in yields, rents and transaction prices, from our own and public data.
Median price per tsubo for 22 Tokyo-area condo brands (Oct 2026). Analyzes brand gaps by location, age and station access, and offers pre-sale checks.
Tokyo 23 Wards Condominium Rental Price Per Square Meter Ranking [September 2026]: Areas with Notable Year-on-Year Increases and How to Interpret the Numbers
Lists Sept 2026 rent per sqm for Tokyo condo listings in 23 wards, highlights big year-on-year rises and the impact of unit-size shifts.
Rent and Sales Trends in Tokyo Minpaku Areas [September 2026] Taito, Sumida, Shinjuku, Toshima, Ota
Sep 2026 analysis of Taito, Sumida, Shinjuku, Toshima, Ota: one-building yields, price/tsubo, listing counts, station rents and ward regulation summary.
Tokyo 23 Wards - Price per Square Meter and Tsubo for Condominiums with Year-on-Year Comparison [September 2026] Central 5 Wards +6%, Other 18 Wards +20%
Sep 2026 median condo price per sqm across Tokyo's 23 wards: ward rankings, YoY central 5 vs other 18 comparison, top risers and seller checklist.
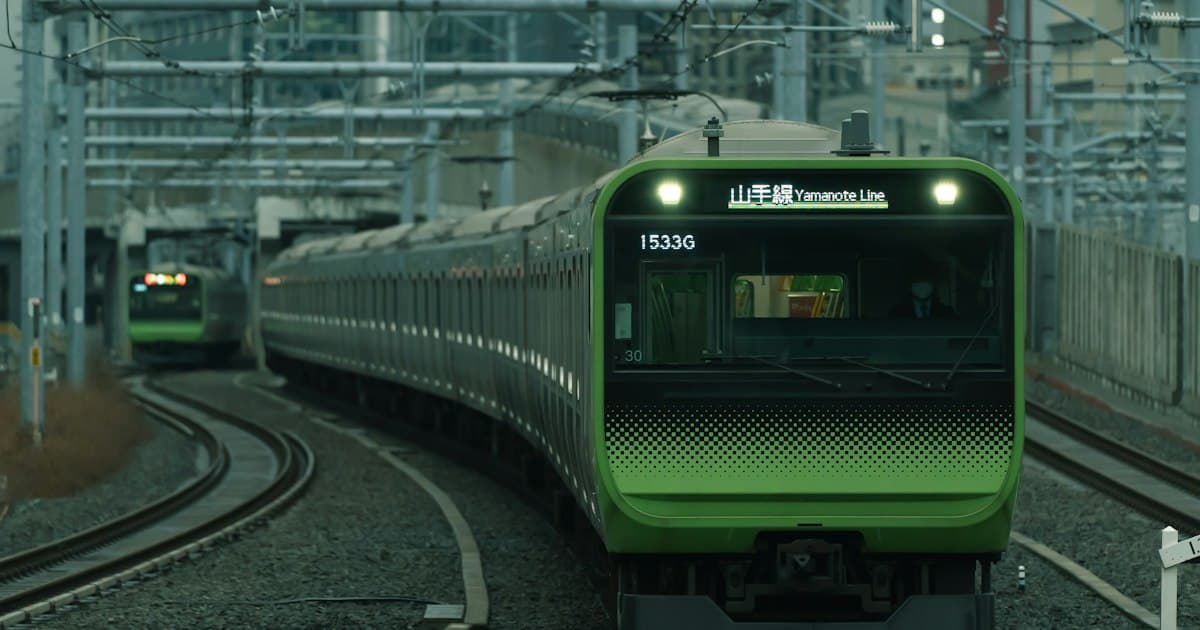
Yamanote Line Station-by-Station One-Building Investment Property Yields and Price Per Tsubo [September 2026] - About 45bps Difference Between East and West Sides
Sep 2026 Yamanote Line listings: median gross yields, price/tsubo, east-west gap ~45bps, station ranges and what investors should check.
2026 Tax Reform and Real Estate Owners: Revision of Inheritance Tax Valuation for Rental Properties Acquired Within 5 Years
2026 reform alters inheritance valuation for rental assets acquired within 5 yrs. Draft NTA: 80% of purchase price from Jan 1, 2027. Impacts & checklist.
Trends in Listing Inventory in Tokyo's 23 Wards [September 2026] - Changes in Whole-Building and Unit Sales by Ward
Sept 2026 listing counts for whole-building income and condo units across Tokyo's 23 wards: year-on-year changes, ward breakdowns, and data caveats.
Ranking of Building Price per Tsubo for Tokyo's 23 Wards Income Properties [September 2026] - Differences between Central Tokyo and Eastern/Northern Areas and Year-on-Year Comparison
Median building price per tsubo in Tokyo's 23 wards (Sept 2026): ward rankings, year-on-year shifts, central vs eastern/northern gaps and factors.
Comparing Whole-Building Yields and Rents in Tokyo’s Central 5 Wards, Eastern, Western, Northern, and Southern Areas [September 2026]
Overview of Tokyo whole-building gross yields, price/tsubo and representative rents by five area groups (Sep 2026). Includes YoY changes and owner tips.
How the Rise in Construction Costs Affects Prices of Used Entire-Building Properties
MLIT cost index up; 2025 rental starts down. Using Urbalytics Tokyo listings, this article explains how cost shifts can alter used entire-building values.
Tokyo Stations with Significant Changes in Gross Yield from May 2026【September 2026】Comparison of 20 Stations with 15+ Income Property Listings
May-Sep 2026 gross yield changes at 20 Tokyo stations (15+ listings). Minami-Senju +150bps, Kanamachi -55bps. Covers 12-month medians and checklist.
Is Tokyo Real Estate in a Bubble? Reading the 2026 Market through Yield and Interest Rate Spreads, and What Owners Should Check Now
Analysis of 2022-2026 Tokyo income property yields vs. 10-year bond and BOJ rates, ward-level differences, and five numeric checks owners should run now.
Tokyo 23 Wards Ranking of Gross Yield for Entire Income Properties【September 2026】Levels and Year-on-Year Comparison by Ward
Tokyo 23 wards median gross yields (Sept 2026): rankings, YoY shifts, listing-based Urbalytics data to gauge ward-level price and yield trends.