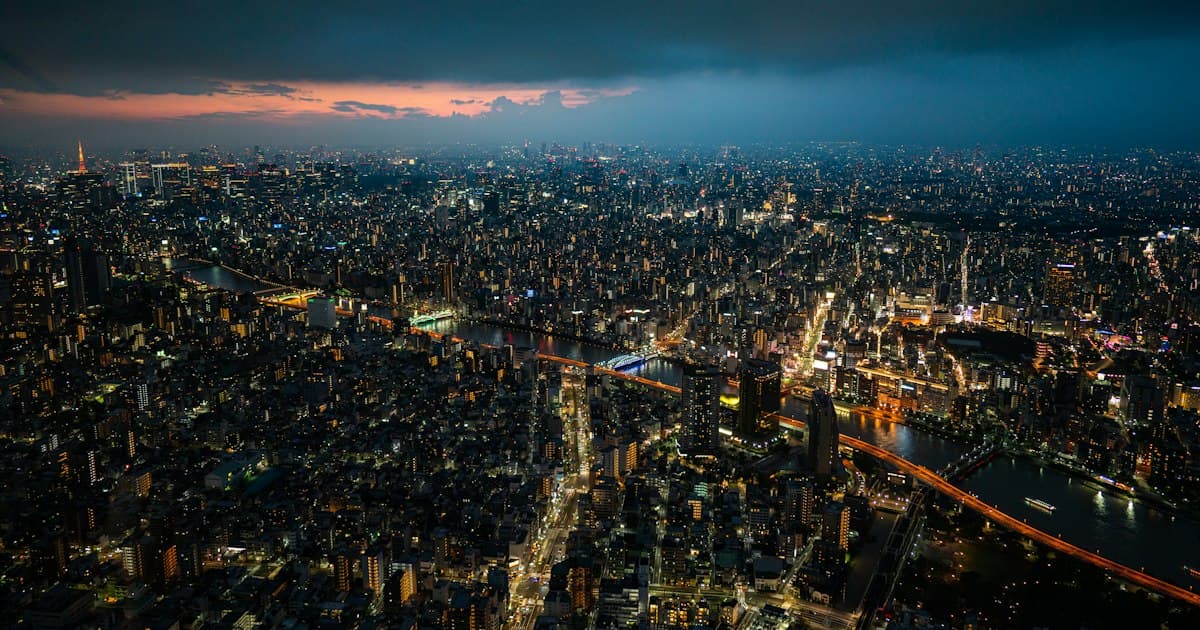
Comparing Whole-Building Yields and Rents in Tokyo’s Central 5 Wards, Eastern, Western, Northern, and Southern Areas [September 2026]
Xingkai LuoNew Business
23 min read
Owners of entire apartment buildings and condominiums in Tokyo’s 23 wards often ask us questions like “Is the yield in my ward higher or lower than in the city center?” or “What is the current market price if I want to sell now?” Data for each ward is available publicly, but comparing all 23 wards at once can make trends difficult to grasp.
In this article, we group the 23 wards into five area groups: "Central 5 wards, Eastern, Northern, Western, and Southern areas" and compare the gross yields, building prices per tsubo, and rental unit asking rents for income properties as of September 2026. We also summarize the differences from the same month the previous year (September 2025) and possible reasons behind the changes.
Key points of this article
- The gross yields of entire income properties (ward median weighted by number of cases) in September 2026 were 3.68% in the Central 5 wards, 4.64% in Southern, 4.84% in Northern and Western, and 5.14% in Eastern areas (Urbalytics Market Report by area).
- The largest year-on-year decline in yield was in the Central 5 wards at −27bps; Eastern declined by −6bps, and Northern was nearly flat with −2bps.
- The building price per tsubo (3.3 sqm) in the Central 5 wards was 5.078 million yen/tsubo compared to 2.559 million yen/tsubo in the Eastern area, about twice as much. However, rents (at representative stations) were 5,529 yen/sqm versus 4,359 yen/sqm (about 1.27 times difference), contributing to the yield gap.
Assignment of 23 Wards into Area Groups and Figures by Ward
There is no fixed official definition for dividing the wards into these groups. Some sources include Setagaya ward in Southern and Nerima ward in Northern. In this article, they are assigned as shown in the table below. The numbers are from Urbalytics Market Report (by area) for September 2026.
| Area Group | Ward | Number of Properties (Sep 2026) | Gross Yield (Sep 2026) | Previous Year Same Month (Difference) | Building Price per Tsubo (Sep 2026) |
|---|---|---|---|---|---|
| Central 5 Wards | Chiyoda Ward | 38 | 3.45% | 4.02%(−57bps) | 488.6万円 |
| Central 5 Wards | Chuo Ward | 33 | 2.77% | 3.52%(−75bps) | 592.7万円 |
| Central 5 Wards | Minato Ward | 43 | 3.20% | 3.33%(−13bps) | 643.6万円 |
| Central 5 Wards | Shinjuku Ward | 127 | 4.21% | 4.29%(−8bps) | 422.8万円 |
| Central 5 Wards | Shibuya Ward | 56 | 3.53% | 3.93%(−40bps) | 559.3万円 |
| Eastern | Taito Ward | 90 | 4.53% | 4.40%(+13bps) | 368.3万円 |
| Eastern | Sumida Ward | 77 | 4.64% | 4.72%(−8bps) | 322.3万円 |
| Eastern | Koto Ward | 61 | 5.11% | 4.76%(+35bps) | 258.2万円 |
| Eastern | Arakawa Ward | 64 | 5.06% | 5.04%(+2bps) | 295.9万円 |
| Eastern | Adachi Ward | 117 | 5.50% | 5.68%(−18bps) | 166.6万円 |
| Eastern | Katsushika Ward | 94 | 5.63% | 5.67%(−4bps) | 222.5万円 |
| Eastern | Edogawa Ward | 93 | 5.27% | 5.43%(−16bps) | 208.9万円 |
| Northern | Bunkyo Ward | 39 | 4.12% | 3.70%(+42bps) | 354.7万円 |
| Northern | Toshima Ward | 108 | 4.58% | 4.50%(+8bps) | 318.0万円 |
| Northern | Kita Ward | 73 | 4.82% | 5.14%(−32bps) | 281.0万円 |
| Northern | Itabashi Ward | 131 | 5.27% | 5.38%(−11bps) | 223.5万円 |
| Western | Setagaya Ward | 138 | 4.34% | 4.67%(−33bps) | 374.5万円 |
| Western | Nakano Ward | 125 | 4.83% | 5.58%(−75bps) | 330.6万円 |
| Western | Suginami Ward | 122 | 4.76% | 4.68%(+8bps) | 311.1万円 |
| Western | Nerima Ward | 110 | 5.58% | 5.07%(+51bps) | 213.2万円 |
| Southern | Shinagawa Ward | 47 | 4.38% | 4.99%(−61bps) | 393.7万円 |
| Southern | Meguro Ward | 39 | 3.82% | 4.03%(−21bps) | 429.8万円 |
| Southern | Ota Ward | 121 | 5.01% | 5.00%(+1bps) | 264.5万円 |
Source: Urbalytics Market Report (by Area, Tokyo Metropolitan Area) and each ward’s whole-building income property page. You can access each ward’s page via the ward name. The number of properties includes properties for sale and under contract (not transactions). Gross yield (expected yield) = annual income ÷ asking price. Building price per tsubo = asking price ÷ building area. Both median values. Checked on October 2, 2026.
At the ward level, yields were highest in Katsushika at 5.63%, Nerima at 5.58%, and Adachi at 5.50%, while Chuo at 2.77%, Minato at 3.20%, and Chiyoda at 3.45% were low. The overall Tokyo median yield is 5.00%. Note that Chiyoda, Chuo, Bunkyo, Meguro, and Minato wards have 30–40 properties each, so the median can shift with even one property change. Wards like Nakano (−75bps) and Nerima (+51bps) showed large shifts in a year, partly due to replacement of properties for sale.
Gross Yield and Building Price per Tsubo by Area Group (Sep 2026 and Previous Year)
Calculating ward medians weighted by the number of properties, the gross yields in September 2026 were 3.68% for the Central 5 wards and 5.14% for Eastern wards, with a 146bps gap. Compared to last year, yields were mostly flat or slightly down in all area groups.
| Area Group | Number of Properties (Sep 2025→Sep 2026) | Gross Yield (Sep 2025→Sep 2026) | Building Price per Tsubo (Sep 2025→Sep 2026) |
|---|---|---|---|
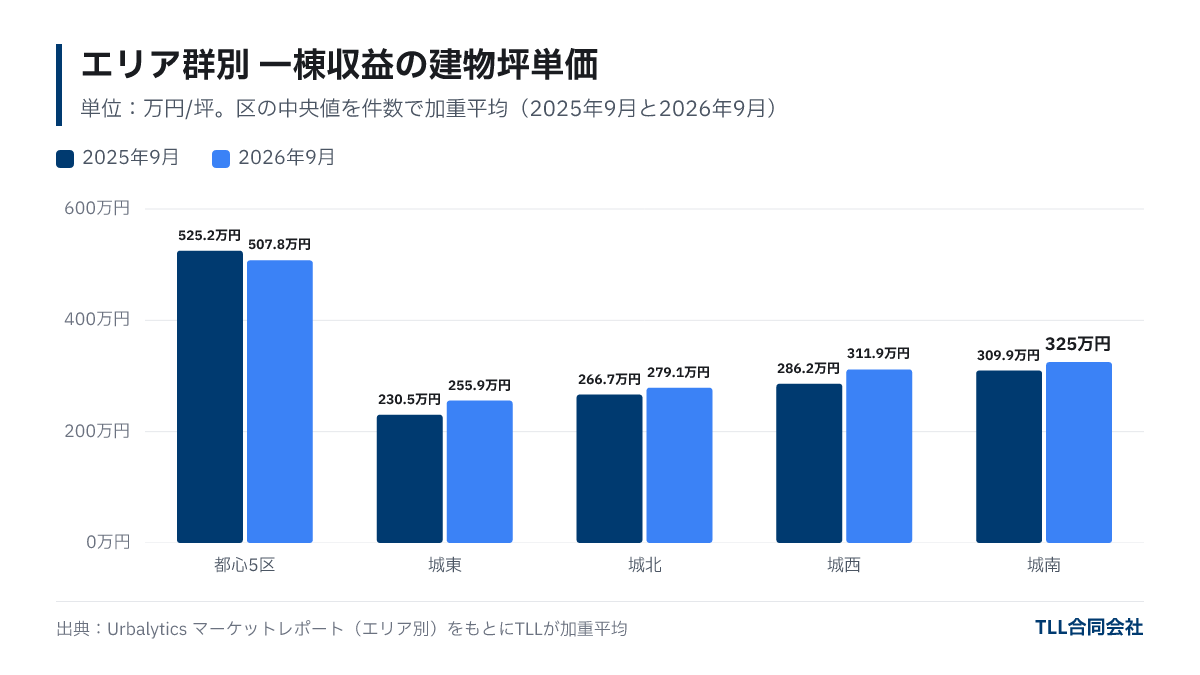
| Central 5 Wards | 205 properties → 297 properties (+44.9%) | 3.95% → 3.68% (−27bps) | 5.252 million yen → 5.078 million yen (−3.3%) |
| Eastern | 544 → 596 (+9.6%) | 5.20% → 5.14% (−6bps) | 2.305 million yen → 2.559 million yen (+11.0%) |
| Northern | 308 → 351 (+14.0%) | 4.85% → 4.84% (−2bps) | 2.667 million yen → 2.791 million yen (+4.7%) |
| Western | 432 → 495 (+14.6%) | 4.98% → 4.84% (−14bps) | 2.862 million yen → 3.119 million yen (+9.0%) |
| Southern | 181 → 207 (+14.4%) | 4.83% → 4.64% (−19bps) | 3.099 million yen → 3.250 million yen (+4.9%) |
Source: Urbalytics Market Report by area, Tokyo metropolitan, September 2025 and September 2026 median values weighted by TLL by number of properties. Not the overall median for area groups. Price per tsubo in million yen/tsubo. Checked October 2, 2026.
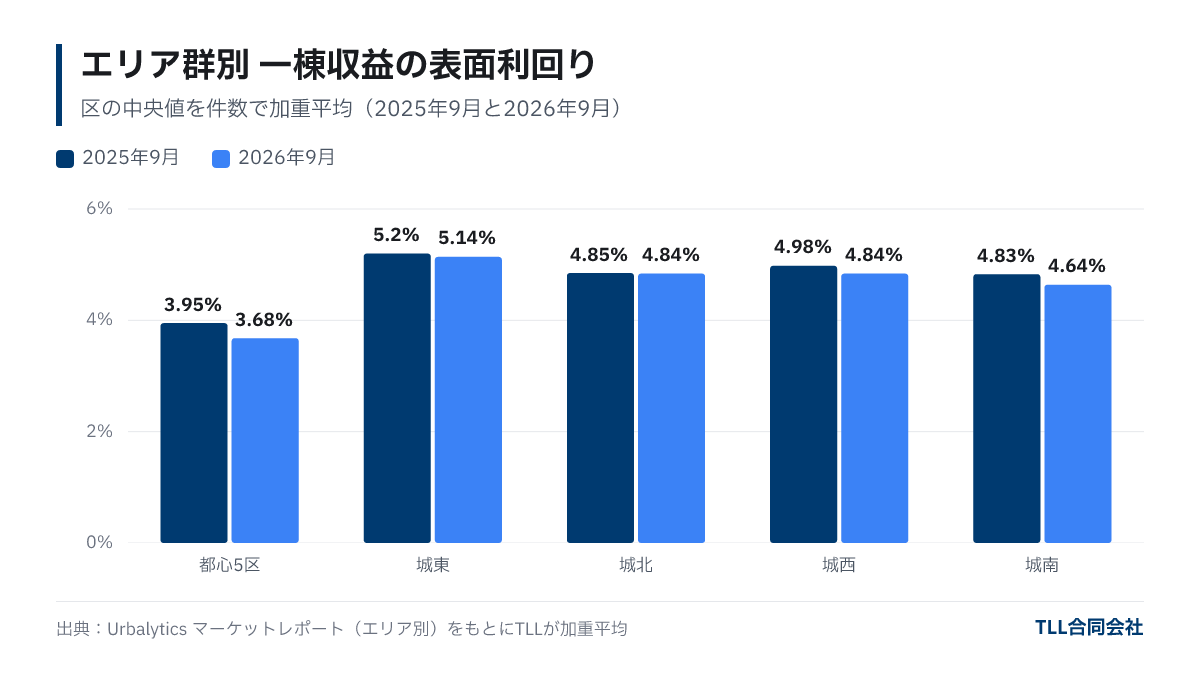
Building price per tsubo was about twice as high in the Central 5 wards at 5.078 million yen/tsubo compared to Eastern at 2.559 million yen/tsubo. Eastern wards showed the greatest increase from the previous year at +11.0%, while Central 5 wards declined −3.3%.
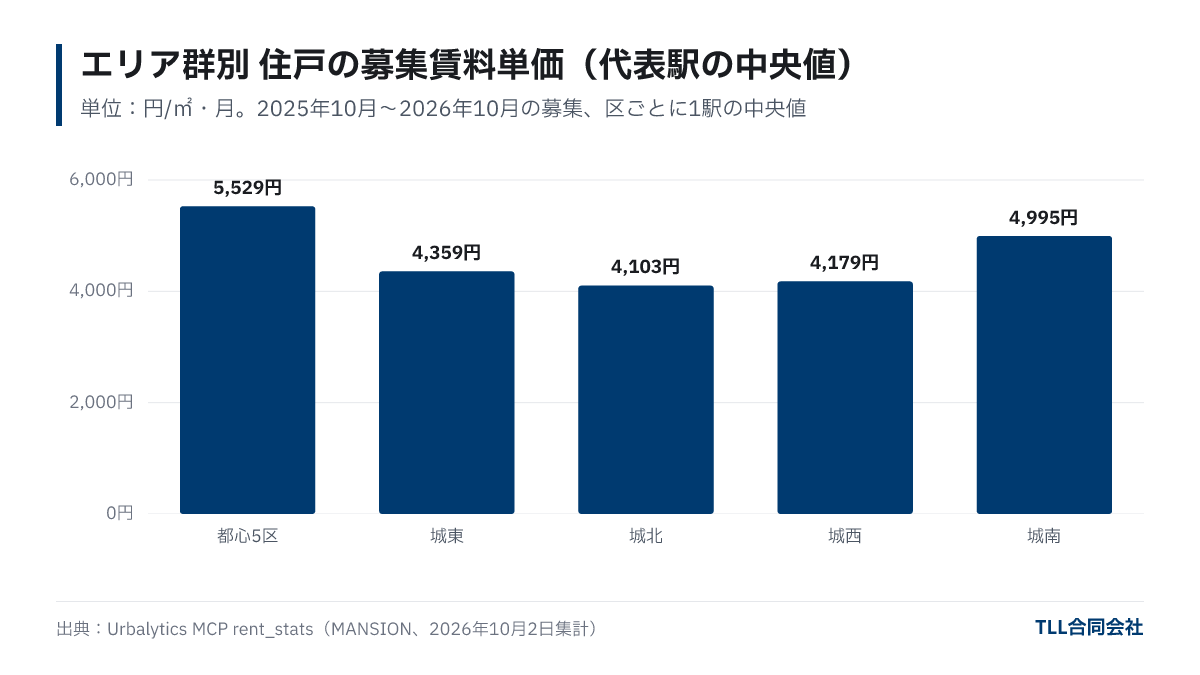
Rent Price per Square Meter by Area Group (Representative Stations)

Because yield is “rent ÷ price,” rent levels should also be considered alongside. The publicly available market report’s rent figures are for office and retail rents, not residential. Therefore, we selected one representative station per ward and examined the median asking rent per square meter over the past 12 months using Urbalytics rent data specifically for residential units (condominiums and apartments).
| Area Group | Representative Stations (Ward) & Median Rent (yen/sqm per month) | Median Within Group |
|---|---|---|
| Central 5 Wards | Jimbocho (Chiyoda) 5,724 / Tsukishima (Chuo) 5,529 / Tamachi (Minato) 5,113 / Takadanobaba (Shinjuku) 4,586 / Ebisu (Shibuya) 5,779 | 5,529 yen |
| Eastern | Asakusa (Taito) 4,401 / Kinshicho (Sumida) 4,556 / Monzen-Nakacho (Koto) 5,033 / Machiya (Arakawa) 3,815 / Kitasenju (Adachi) 4,359 / Kameari (Katsushika) 3,484 / Nishikasai (Edogawa) 3,191 | 4,359 yen |
| Northern | Myogadani (Bunkyo) 4,380 / Ikebukuro (Toshima) 4,464 / Akabane (Kita) 3,658 / Oyama (Itabashi) 3,826 | 4,103 yen |
| Western | Sangenjaya (Setagaya) 4,447 / Nakano (Nakano) 4,684 / Ogikubo (Suginami) 3,910 / Nerima (Nerima) 3,722 | 4,179 yen |
| Southern | Oimachi (Shinagawa) 4,995 / Nakameguro (Meguro) 5,529 / Kamata (Ota) 4,425 | 4,995 yen |
Source: Urbalytics rent data (rent_stats, residential units = condominiums and apartments). Asking rents posted between October 2, 2025 and October 2, 2026 with duplicate listings for the same building, size, and rent merged into one. Number of data points per station: 176–1,103. Representatives stations were selected by TLL for each ward and do not represent the ward average. Aggregated October 2, 2026.
The rent price per square meter in the Central 5 wards (5,529 yen/sqm) is about 1.27 times that of the Eastern area (4,359 yen/sqm). At the same time, building price per tsubo shows about a twofold difference. Because rents do not differ as much as prices, yields are lower in the Central 5 wards and higher in Eastern. The Southern area has a rent price of 4,995 yen/sqm close to the Central 5 wards, while its building price per tsubo is 3.25 million yen, about 60% of Central, putting its yield at a middling 4.64%.
What Has Moved and Possible Reasons
Compared to the same month last year, the notable movements are the yield decline in the Central 5 wards (−27bps) and the building price per tsubo rise in Eastern and Western areas (+11.0%, +9.0%).
- Yield decline in the Central 5 wards: Chuo dropped from 3.52% to 2.77%, and Chiyoda from 4.02% to 3.45%. Meanwhile, building price per tsubo fell from 5.732 million yen to 4.886 million yen in Chiyoda and from 6.823 million yen to 5.593 million yen in Shibuya. This indicates the yield drop cannot be explained by price increases. The number of properties increased approximately 45% from 205 to 297, suggesting a change in the types of properties listed for sale (commercial buildings, new builds, older buildings) greatly influenced the figures.
- Building price rise in Eastern area: Taito increased from 3.121 million yen to 3.683 million yen, Sumida from 2.701 million yen to 3.223 million yen. This likely reflects buyer interest anticipating lodging demand around Asakusa and Oshiage, as well as higher construction costs pushing up asking prices for new builds (Rising construction costs and prices of used entire buildings).
- Increase in number of properties: All area groups saw 10–40% increases in numbers of properties. This could indicate more properties on the market, but may also include changes in Urbalytics’ data collection scope. Therefore, it is advisable not to interpret changes in supply and demand solely by property counts.
For Tokyo as a whole, 767 whole-building income properties were discounted in August 2026, with a median discount of −5.0% (Urbalytics Price Reduction Watch). Because asking prices and actual transaction prices differ, yields based on asking prices should be read as the seller’s desired levels.

Points Owners Should Confirm
The yields by area group and ward serve as a starting point for estimating your property’s price. Before deciding to hold or sell, checking the following points can help you identify discrepancies with the market.
- Calculate your property’s gross yield: Divide your current annual rental income by the ward’s gross yield to estimate an approximate asking price. For example, a property earning 12 million yen annually would be about 230 million yen at Eastern’s 5.14% yield and roughly 330 million yen at the Central 5 wards’ 3.68%. This is a rough estimate based on asking price levels, not an appraisal or guaranteed transaction price.
- Reasons for deviating from ward median: Factors such as building age, distance from station, vacancy rate, rebuild eligibility, and whether the land is leased can cause yields in the same ward to vary by 1–2 percentage points.
- Rent levels matching the market: If your rental income is lower than surrounding asking rents, raising rents may increase your property’s value.
- Gap between asking and sale price: The data shows asking prices, not transaction prices. Prices often drop before closing, so plan assuming price adjustments after listing.
For detailed explanations of price calculations, see How whole-building apartment appraisal values are determined, and for the sales process, see The process for selling income properties. TLL’s free appraisal service provides price estimates reflecting ward market trends and individual property conditions.
Frequently Asked Questions
Q. Which wards are the Central 5 wards?
They generally refer to Chiyoda, Chuo, Minato, Shinjuku, and Shibuya wards. This article uses these five as the Central 5 wards.
Q. Are the boundaries for Eastern, Western, Northern, and Southern areas fixed?
There is no official definition. Some sources vary in assigning Setagaya and Nerima wards. The assignments in this article are as shown in the table and are for comparison convenience.
Q. Did yields drop compared to last year because prices rose?
If rents are unchanged, yield decreases mean price increases. However, ward medians are affected by the composition of properties listed. For example, in the Central 5 wards, building prices per tsubo declined but yields also dropped, suggesting lease mix changes significantly influenced yields.
Q. Will my property sell at these yields?
The yields shown are median figures based on asking prices and do not guarantee closing prices. Individual factors such as building age and vacancy will affect actual prices. Please obtain an appraisal for specific valuation.
Summary
- In September 2026, the gross yields for entire income properties were 3.68% in the Central 5 wards, 4.64% in the Southern area, 4.84% in the Northern and Western areas, and 5.14% in the Eastern area.
- Year-on-year comparison shows the largest yield decline in the Central 5 wards at −27bps, with Eastern and Northern nearly flat.
- The building price per tsubo in the Central 5 wards is about twice the Eastern area, while rent price per square meter is about 1.27 times higher, creating the yield differences.
- Ward figures are medians of asking prices. Assess your own property by considering reasons for deviation and rent level consistency before making decisions.
About this article
- Author
- Xingkai Luo(New Business)
A business development specialist with over 10 years of experience in urban real estate development and infrastructure investment. At Alibaba and Honeywell, he led large-scale redevelopment projects for major Chinese state-owned transportation operators and oversaw the implementation of smart building solutions. He is deeply familiar with the full development value chain, from due diligence, land acquisition, and structuring through post-completion asset management. At TLL, he leads new business development and project formation for overseas investors, advancing hotel, residential, and mixed-use developments.
View profile → - Publisher
- TLL合同会社宅地建物取引業 東京都知事(1)第108202号住宅宿泊管理業 国土交通大臣(01)第F03424号
Data in this article cite their source and as-of date. Market conditions and regulations change, so check the latest information and consult a professional before deciding. Translated from the Japanese original.