Is Tokyo Real Estate in a Bubble? Reading the 2026 Market through Yield and Interest Rate Spreads, and What Owners Should Check Now
Xingkai LuoNew Business
21 min read
The question "Is Tokyo real estate in a bubble?" has increasingly come from both owners considering selling and investors considering buying. In the 2026 land price announcement, commercial land prices in Tokyo’s 23 wards rose 13.8% year-on-year (Tokyo Metropolitan Government, as of January 1, 2026), while the Bank of Japan raised the policy interest rate to about 1.25% in September 2026.
Judging whether it is a bubble solely by price increases tends to lead to discussions based more on impressions than facts. This article organizes gross yields from Urbalytics listing data alongside the Bank of Japan’s policy rate and the Ministry of Finance’s 10-year government bond yields in a single table, from the standpoint of how much income property prices can be explained by rent and interest rates. This is not an article forecasting future prices, but rather one to confirm what can and cannot be inferred from current figures.
Key points of this article
- The average gross yield on Tokyo’s income properties (based on listings, weighted by number of transactions) fell from 5.93% in December 2022 to 5.00% in September 2026 (Urbalytics Market Report).
- In the same period, the 10-year government bond yield rose from 0.454% to 3.057% (Ministry of Finance, month-end values), shrinking the spread between gross yield and long-term interest rates from about 5.5 points to about 1.9 points.
- As of September 2026, Chuo Ward’s gross yield is 2.77%, Minato Ward’s is 3.20%, roughly the same as long-term rates. Meanwhile, Nerima Ward, Adachi Ward, and Katsushika Ward have yields around 5.5%, showing large differences by ward.
Conclusion: Conditions differ from around 1990, but the margin against interest rates is shrinking
The present numbers show that across Tokyo, income property gross yields still exceed long-term interest rates, so prices are not completely inexplicable by rental income. However, that margin has shrunk to about one-third in just over three years. Also, in some central areas, gross yields have fallen to the point of matching long-term interest rates.
Whether it is a bubble can only be decided in hindsight. For owners, what matters more than labels is confirming the difference between their property’s yield and borrowing interest rates, and whether they can endure further interest rate rises.

Trends in Gross Yields and Interest Rates (Dec 2022 – Sep 2026)
The price of income real estate is roughly determined by "annual rent ÷ yield" (income capitalization method). The yield investors demand is usually the government bond yield plus a premium reflecting the risks of real estate. Therefore, looking at the spread between gross yield and long-term interest rates shows how well rent and interest rates balance against price.
| Date | Gross Yield (Tokyo, Income Properties) | Bank of Japan Policy Rate | 10-Year Government Bond Yield | Yield − Long-Term Rate |
|---|---|---|---|---|
| September 1990 | No company data | 6.0% (Official Discount Rate) | 8.105% | — |
| December 2022 | 5.93% | −0.1% | 0.454% | 5.48pt |
| December 2023 | 5.39% | −0.1% | 0.647% | 4.74pt |
| December 2024 | 5.09% | 0.25% | 1.111% | 3.98pt |
| September 2025 | 5.16% | 0.5% | 1.662% | 3.50pt |
| December 2025 | 5.15% | 0.75% | 2.066% | 3.08pt |
| September 2026 | 5.00% | 1.25% | 3.057% | 1.94pt |
Source: Gross yields from the Urbalytics Market Report (Tokyo), the Tokyo average for income properties (annual income of listed properties ÷ list price; weighted average by number of data points in areas with 3 or more data points; not based on transaction prices. 2,394 listings in September 2026). Policy rates are midpoints determined by the Bank of Japan’s Monetary Policy Meetings (negative rate policy through March 2024, discount rate in 1990). The 10-year government bond yield is based on Ministry of Finance month-end values. Aggregated on October 2, 2026.
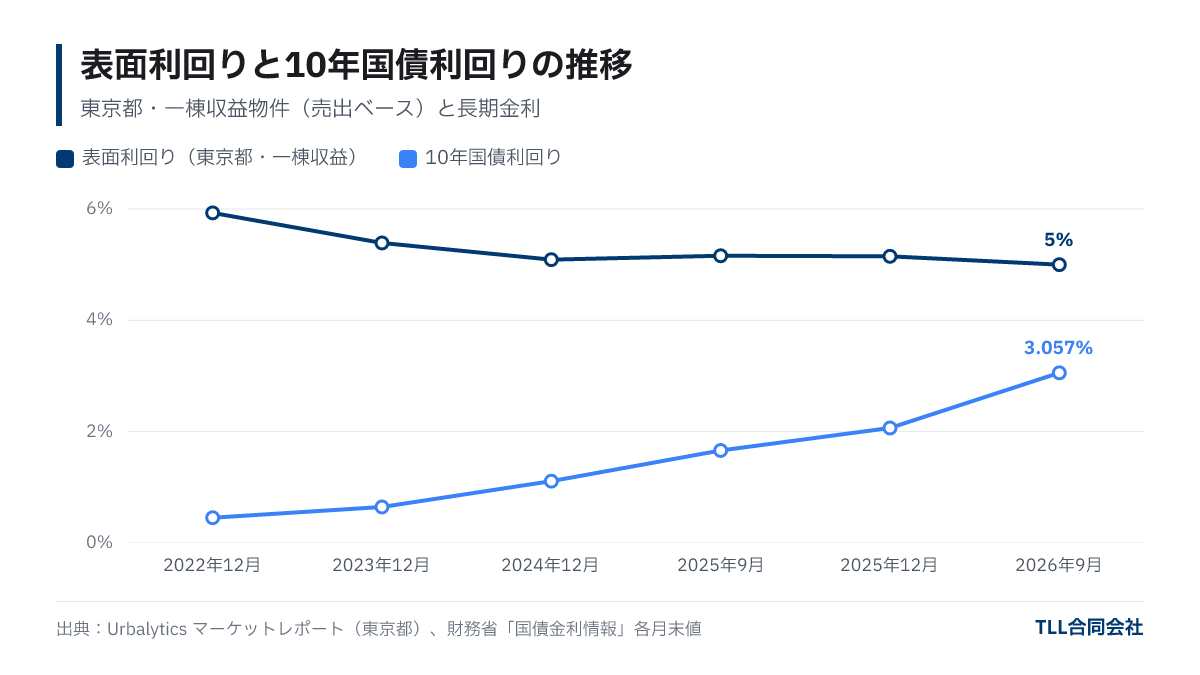
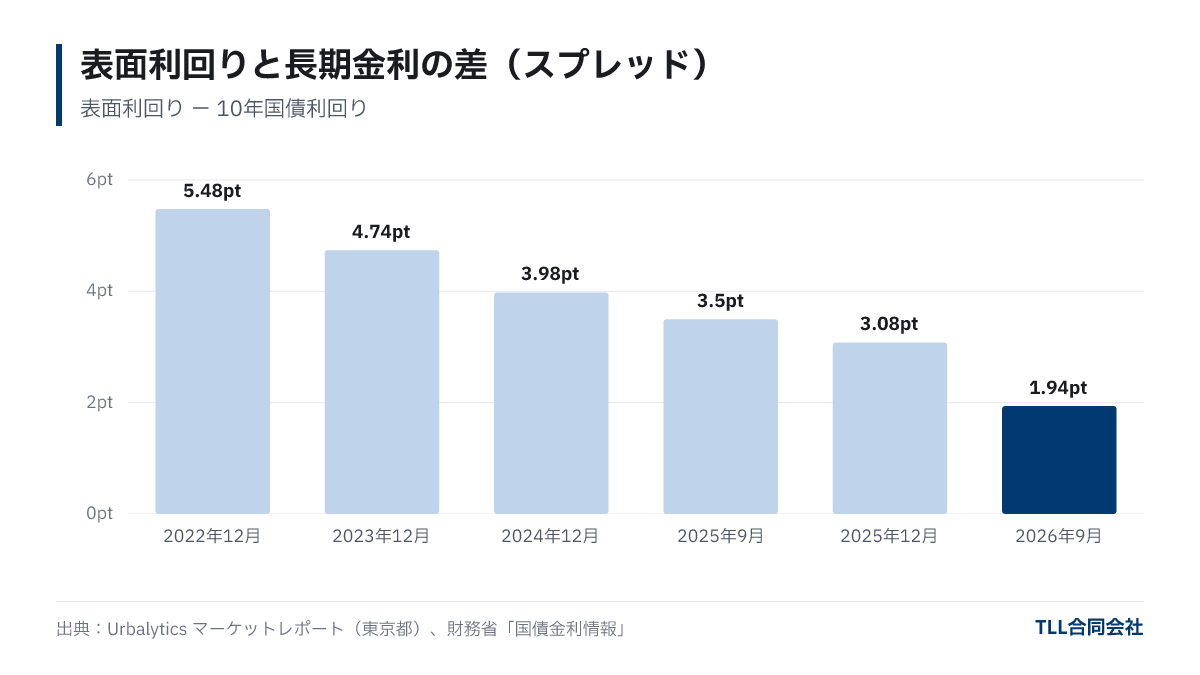
Three points can be drawn from the table. First, gross yield fell by 93 basis points, indicating that prices have risen faster than rents. Second, interest rates rose far more, with the 10-year government bond yield increasing by about 2.6 points. Third, as a result, the spread narrowed from 5.48 points to 1.94 points. This means that yields have yet to catch up fully with interest rates and that rising rates may not yet be fully reflected in prices.
Large differences by ward: Central wards’ yields approach long-term interest rates
The Tokyo average of 5.00% masks significant variability by ward. Comparing ward-level yields in September 2026 with the 10-year government bond yield of 3.057% at month-end shows the following:
| Ward | Gross Yield (Sep 2026) | Number of Data Points | Difference from 10-Year Bond Yield |
|---|---|---|---|
| Chuo Ward | 2.77% | 33 cases | −0.29pt |
| Minato Ward | 3.20% | 43 cases | +0.14pt |
| Chiyoda Ward | 3.45% | 38 cases | +0.39pt |
| Shibuya Ward | 3.53% | 56 cases | +0.47pt |
| Setagaya Ward | 4.34% | 138 cases | +1.28pt |
| Adachi Ward | 5.50% | 117 cases | +2.44pt |
| Nerima Ward | 5.58% | 110 cases | +2.52pt |
| Katsushika Ward | 5.63% | 94 cases | +2.57pt |
Source: Urbalytics Market Report, ward-level gross yields on income properties (median based on listings, September 2026). The 10-year government bond yield is from the Ministry of Finance, September 30, 2026. Be aware that wards with only 30 to 40 data points can show substantial fluctuations from one additional or removed case. Aggregated on October 2, 2026.
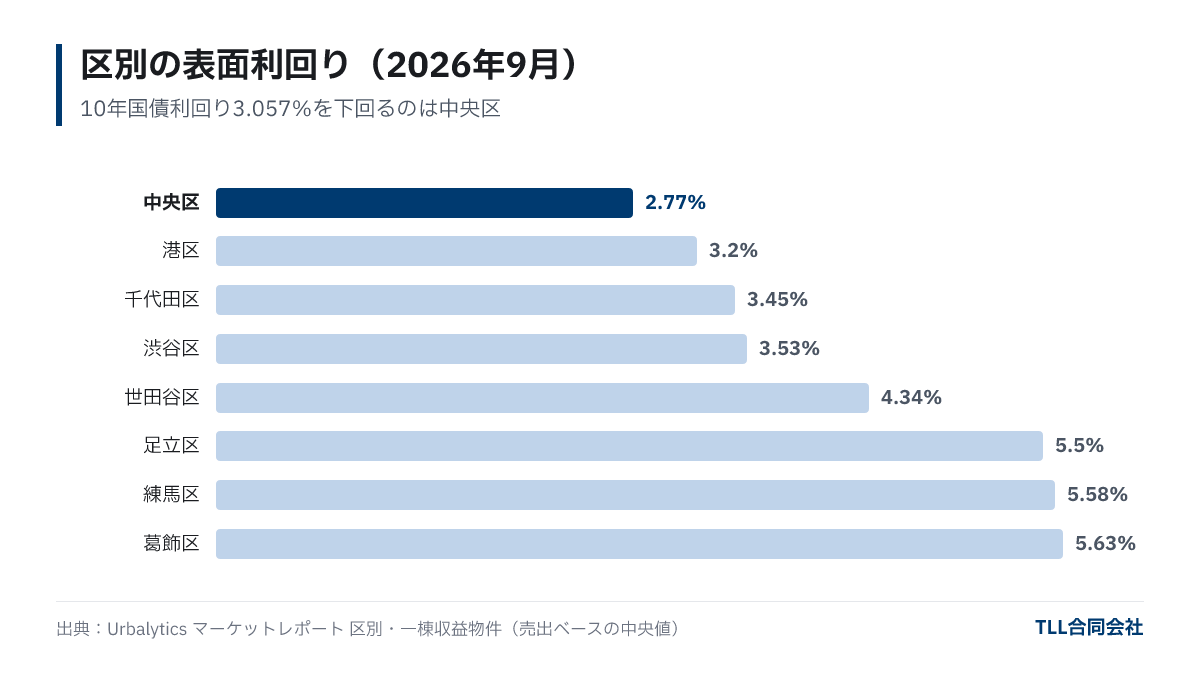
In the three central wards plus Shibuya, the spread between gross yield and government bond yield is less than 0.5 points, and in Chuo Ward it is even negative. Since net yields after expenses and vacancies are lower than gross yields, prices in these areas are likely supported by not only rental income but also asset preservation demand, expectations for future price appreciation, and low financing costs.
There are also differences in price trends. In Setagaya Ward, building unit prices for income properties rose 52.7% from ¥2,453,000/tsubo to ¥3,745,000/tsubo from December 2022 to September 2026, while gross yield dropped 96 basis points from 5.30% to 4.34%. In Nerima Ward over the same period, building unit prices rose only 5.2%, with a 41 basis point drop in yield (Setagaya Ward and Nerima Ward Market Reports). It is important not to lump all "Tokyo real estate" together but to consider area differences.
Difference from around 1990 (1): Is there rental income support?
The biggest difference from the bubble period around 1990 is the interest rate level. Ministry of Finance data show that the 10-year government bond yield was 8.105% at the end of September 1990, and 6.619% at the end of December that year. Since we do not have comparable yield data for income properties then, direct comparisons are difficult, but at levels of 6–8%, it was difficult to cover borrowing costs from rent alone, leading to widespread speculation based on expected price appreciation.
As of September 2026, Tokyo’s average gross yield of 5.00% exceeds the long-term rate of 3.057%, so rent generally underpins prices. This differs from the situation around 1990. However, as noted above, in some central areas yields nearly match rates, so it cannot be definitively said that rent fully supports prices in all areas.

Difference from around 1990 (2): Lending stance and rate increases
Around 1990, credit supply was suddenly tightened. The Bank of Japan raised the official discount rate in stages from May 1989, reaching 6.0% on August 30, 1990. The Ministry of Finance also issued so-called total volume regulations in March 1990, limiting real estate lending to grow less than total lending. The combination of sharp interest rate hikes and quantitative loan restrictions amplified subsequent price declines.
This time, policy rates have risen about 1.35 points over about two and a half years from the end of the negative interest rate policy in March 2024 to 1.25% in September 2026. Compared to the 3.5-point rise in 15 months from 2.5% to 6.0% in 1989–1990, both the magnitude and pace are milder. There is currently no regulatory limit on lending volumes. However, since the inappropriate lending issues that surfaced for investment real estate in 2018, financial institutions reportedly have been more cautious in reviewing borrowers' equity and repayment capacity, so borrowing conditions are not like the late 1980s.
A key concern is that for owners borrowing at variable interest rates, increases in the policy rate directly affect repayment amounts. For a ¥100 million loan, a 1% interest rate increase means about ¥1 million more interest per year. For a property bought fully financed at ¥100 million with a 5% gross yield (¥5 million rent per year), this increase equals 20% of rental income.
What owners should check now
Regardless of market labels, confirming the following five points with numbers makes it easier to make decisions about selling, holding, or buying more:
- The difference between your property’s yield and borrowing interest rate: Calculate using net yield after deducting expenses and vacancy, not gross yield.
- Cash flow impact if interest rates rise 1–2 points: Estimate whether net income remains positive after repayments with interest rates adjusted for variable rates or post-fixed periods.
- Whether rents have caught up with market levels: Check differences between current rents and nearby listed rents to understand room for revision upon renewal or tenant replacement.
- Loan maturity and refinancing conditions: If maturity or fixed-rate period is near, confirm whether refinancing might occur during high interest rate periods.
- Current property price: Understand how your property is valued based on yield levels in the same area. The valuation process is explained in How Are Apartment Building Valuations Determined?
If considering buying more, the relationship between leverage and rising interest rates is organized in How to Expand Scale in Income Property Investment. If you want to know the current value of your property, we offer a free appraisal based on yield and surrounding data.

Frequently Asked Questions
Q. Will Tokyo real estate prices fall from now?
It is impossible to definitively predict future prices. Useful indicators to watch are whether the spread between gross yield and long-term interest rates continues to shrink, or whether listing inventory increases.
Q. Why compare gross yield and long-term interest rates?
Investors generally require yields that add a risk premium to safe assets like government bonds. The smaller the difference, the more the price may be supported by factors other than rent.
Q. How do rising interest rates affect income property prices?
Under the income capitalization method, if required yields rise, prices fall even if rents remain the same. Generally, rising rates push prices down, but rent increases may offset this, so it is important to monitor rent trends together with interest rates.
Q. Is now a good time to sell?
Whether it is a good time to sell depends on your property yield, loan conditions, and cash flow from holding. We recommend first understanding your current valuation and comparing it with income after expenses.
Summary
- The gross yield on Tokyo’s income properties is 5.00% (September 2026, Urbalytics), still above the 10-year government bond yield of 3.057%, indicating that on average rents underpin prices.
- However, the spread narrowed from 5.48 points in December 2022 to 1.94 points in September 2026, and some central wards such as Chuo (2.77%) and Minato (3.20%) have yields nearly on par with rates.
- Around 1990, long-term rates were 6–8%, discount rate 6.0%, along with total volume lending regulations. This time, rate hikes have been gradual with no regulatory lending volume limits, but lenders are more cautious.
- Owners should focus less on market labels and more on the difference between net yield and borrowing costs, cash flow under potential rate rises, and current property valuation.
*Note: Gross yields are based on asking conditions for listings, not transaction prices or actual income. Some data for April 2026 income properties are missing and are excluded from comparisons.
Featured image (image): Photo: Ramses Cabello / Unsplash
About this article
- Author
- Xingkai Luo(New Business)
A business development specialist with over 10 years of experience in urban real estate development and infrastructure investment. At Alibaba and Honeywell, he led large-scale redevelopment projects for major Chinese state-owned transportation operators and oversaw the implementation of smart building solutions. He is deeply familiar with the full development value chain, from due diligence, land acquisition, and structuring through post-completion asset management. At TLL, he leads new business development and project formation for overseas investors, advancing hotel, residential, and mixed-use developments.
View profile → - Publisher
- TLL合同会社宅地建物取引業 東京都知事(1)第108202号住宅宿泊管理業 国土交通大臣(01)第F03424号
Data in this article cite their source and as-of date. Market conditions and regulations change, so check the latest information and consult a professional before deciding. Translated from the Japanese original.