Yamanote Line Station-by-Station One-Building Investment Property Yields and Price Per Tsubo [September 2026] - About 45bps Difference Between East and West Sides
Chen Tan (licensed real estate broker, 宅地建物取引士)Founder
22 min read
When searching for entire apartment buildings or office buildings within the Yamanote Line inner area or near stations, questions often arise such as "How different are yields by station?" or "Which is more affordable, the east or west side?" While gross yields of individual properties can be seen in listings, there are few publications comparing levels by station.
In this article, based on sales listing data collected by Urbalytics, we have tabulated the gross yields (expected yields) and building price per tsubo for one-building income properties at Yamanote Line stations with sufficient data out of the 30 stations, as of September 2026. Note that all numbers are based on listing prices (seller's asking prices), not transaction prices.
Key points of this article
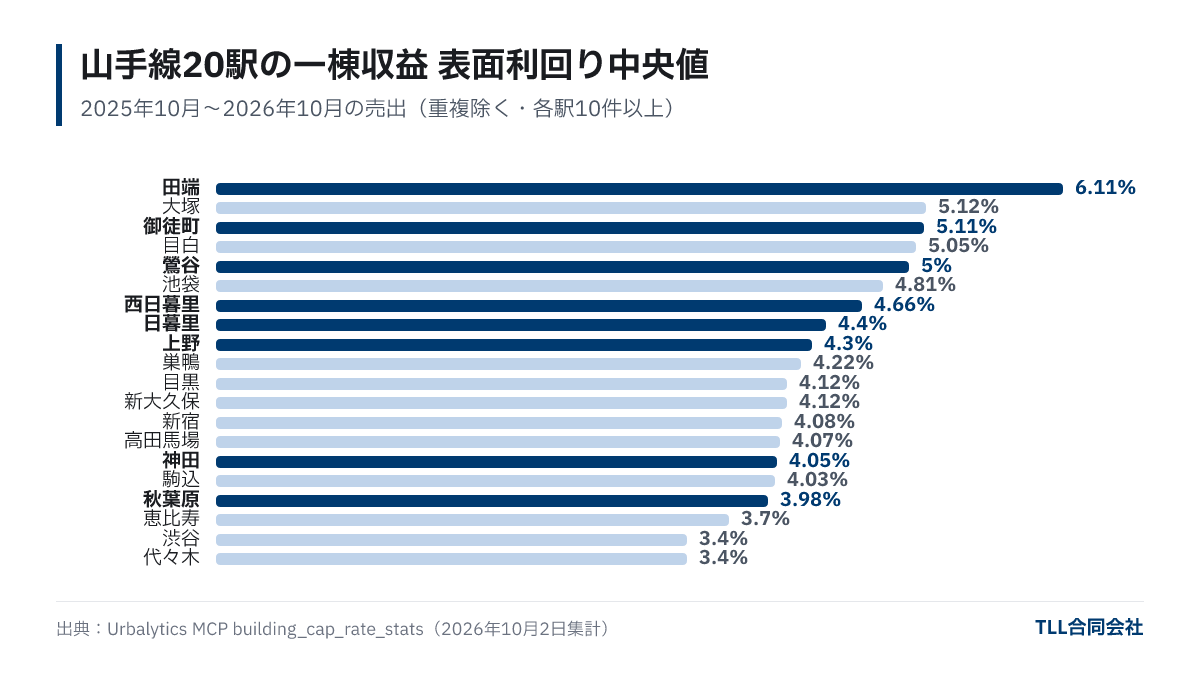
- Among one-building income properties listed or with price changes from October 2025 to October 2026, at 20 Yamanote Line stations with more than 10 listings, the median gross yield ranged from 3.40% (Shibuya/Yoyogi) to 6.11% (Tabata) (Urbalytics sales data, excluding duplicate listings).
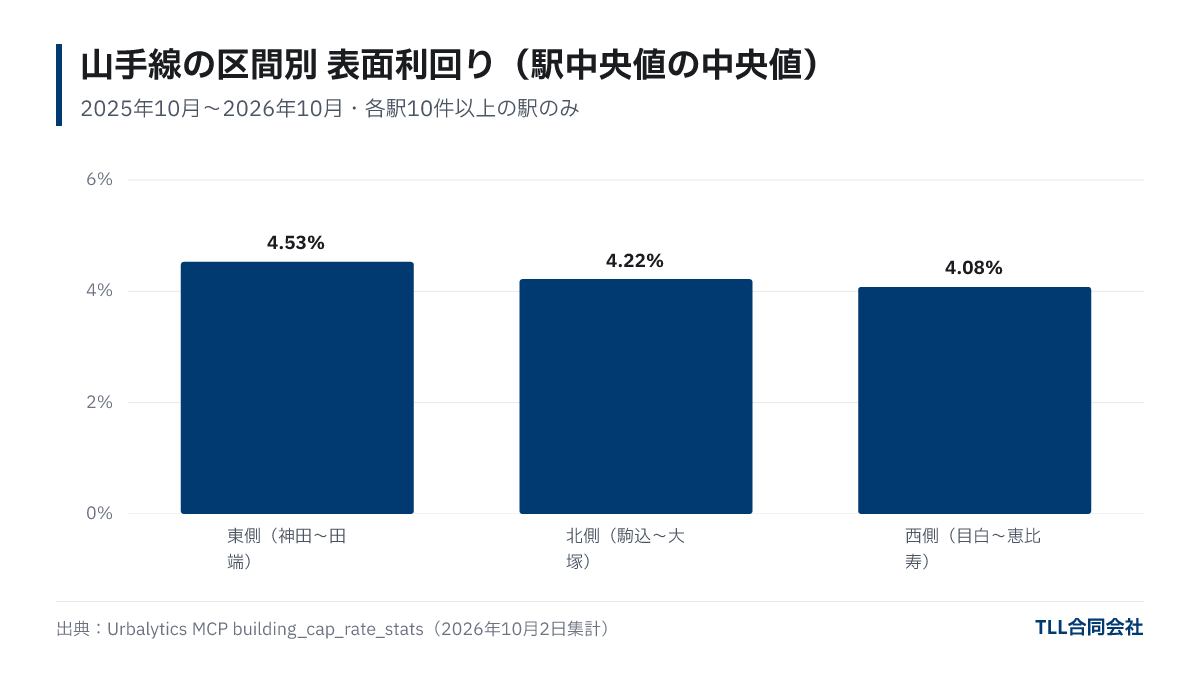
- The median yield at the 8 east side stations from Kanda to Tabata was 4.53%, while that of the 8 west side stations from Mejiro to Ebisu was 4.08%, with the east side approximately 45 basis points higher.
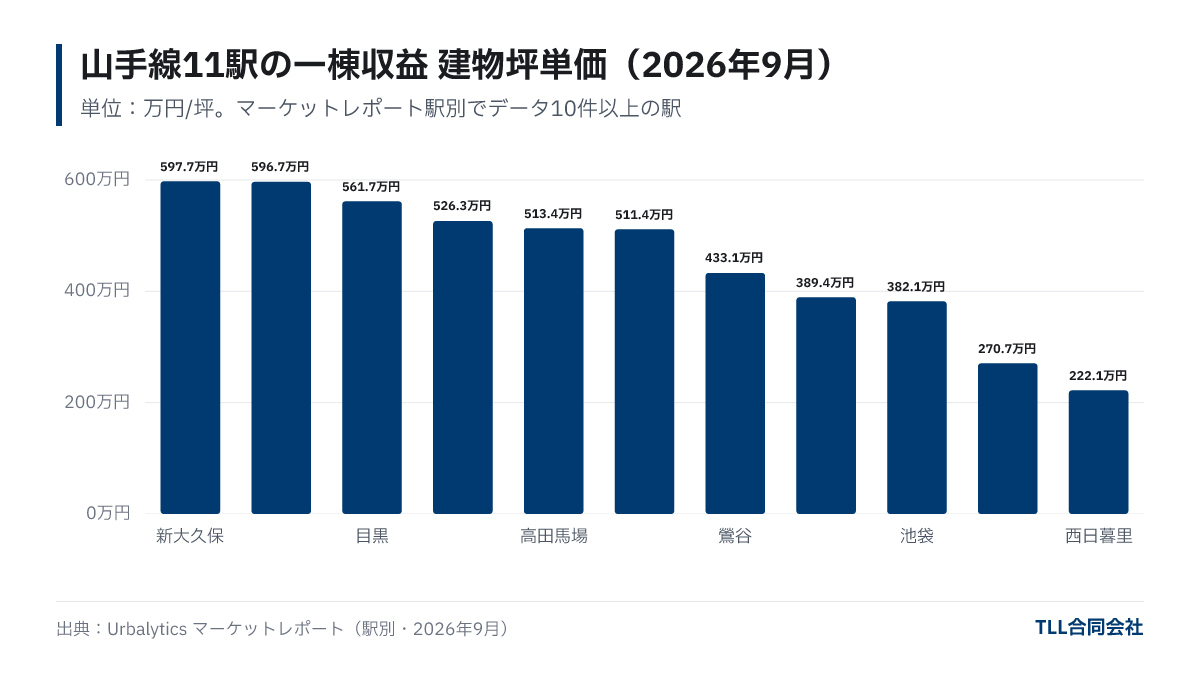
- Price per tsubo of buildings in September 2026 ranged from 2.221 million yen/tsubo (Nishi-Nippori) to 5.977 million yen/tsubo (Shin-Okubo) across 11 stations with more than 10 listings, a spread of about 2.7 times (Urbalytics Market Report by station).
Yamanote Line Station-by-Station Gross Yield List for One-Building Income Properties
Looking at sales listing data over the past 12 months, the median gross yields at 20 Yamanote Line stations range between mid-3% to just over 6%. Monthly listing counts vary by station, often only a few. Here, we aggregate listings or price changes from October 2, 2025, through October 2, 2026, and include only stations with 10 or more listings.
| Station | Number of Listings | Median Gross Yield | Middle 50% Range (P25–P75) |
|---|---|---|---|
| Tabata | 20 | 6.11% | 5.09–6.66% |
| Otsuka | 34 | 5.12% | 4.07–7.58% |
| Okachimachi | 11 | 5.11% | 4.20–7.76% |
| Mejiro | 10 | 5.05% | 3.95–5.38% |
| Uguisudani | 20 | 5.00% | 4.41–6.38% |
| Ikebukuro | 75 | 4.81% | 3.97–5.56% |
| Nishi-Nippori | 22 | 4.66% | 4.22–7.66% |
| Nippori | 23 | 4.40% | 3.92–5.50% |
| Ueno | 16 | 4.30% | 3.51–6.55% |
| Sugamo | 18 | 4.22% | 3.82–4.69% |
| Meguro | 29 | 4.12% | 3.60–4.80% |
| Shin-Okubo | 22 | 4.12% | 3.40–4.54% |
| Shinjuku | 16 | 4.08% | 3.60–5.18% |
| Takadanobaba | 41 | 4.07% | 3.94–5.00% |
| Kanda | 12 | 4.05% | 3.63–5.47% |
| Komagome | 25 | 4.03% | 3.80–4.62% |
| Akihabara | 26 | 3.98% | 3.20–4.77% |
| Ebisu | 25 | 3.70% | 3.20–3.90% |
| Shibuya | 21 | 3.40% | 3.11–3.99% |
| Yoyogi | 13 | 3.40% | 3.24–4.79% |
Source: Urbalytics sales data (building_cap_rate_stats). Data includes one-building income properties with the nearest station recorded as the station name, listed or with price changes from October 2, 2025 to October 2, 2026. Duplicate listings across multiple sites counted as one. Yields under 1% or over 25% excluded. Gross yield = annual listed income ÷ listing price. Tabulated on October 2, 2026.
Stations with fewer than 10 listings were excluded (Gotanda 8, Harajuku 8, Shinbashi 7, Osaki 6, Tamachi 3, Takanawa Gateway 3, Tokyo 2, Shinagawa 2, Hamamatsucho 2, Yurakucho 0). The southeast area from Shinagawa to Shinbashi is mainly office and commercial zones, so there are few listings for one-building apartments or small office buildings. The 3 listings at Takanawa Gateway were repeats of the same building, with an extreme median yield over 11%, and thus not used. Stations with 10–20 listings have small samples, so a change of one listing can move the median.
September 2026 Station-by-Station Gross Yield and Building Price Per Tsubo
The latest monthly values can be checked in the Urbalytics public Market Report (by station). In September 2026, 11 Yamanote Line stations had 10 or more listings, with median gross yields ranging from 3.52% (Meguro) to 5.50% (Uguisudani) and building price per tsubo from 2.221 million yen to 5.977 million yen.
| Station | Number of Listings | Gross Yield | Difference from Tokyo Average (5.00%) | Building Price Per Tsubo |
|---|---|---|---|---|
| Uguisudani | 12 | 5.50% | +50bps | 4.331 million yen |
| Nishi-Nippori | 13 | 5.08% | +8bps | 2.221 million yen |
| Ikebukuro | 39 | 4.81% | −19bps | 3.821 million yen |
| Nippori | 14 | 4.80% | −20bps | 2.707 million yen |
| Akihabara | 16 | 4.56% | −44bps | 5.263 million yen |
| Shin-Okubo | 11 | 4.54% | −46bps | 5.977 million yen |
| Ueno | 10 | 4.38% | −62bps | 5.114 million yen |
| Komagome | 12 | 4.19% | −81bps | 3.894 million yen |
| Takadanobaba | 11 | 4.04% | −96bps | 5.134 million yen |
| Ebisu | 12 | 3.61% | −139bps | 5.967 million yen |
| Meguro | 10 | 3.52% | −148bps | 5.617 million yen |
Source: Urbalytics Market Report (by station, Tokyo area, data from September 2026). Clicking station names leads to individual one-building income property pages. The number of listings includes both active and under-contract listings, not transaction count. Median gross yields and building price per tsubo (listing price ÷ building area) shown. Data only published for months with 10 or more listings. Confirmed October 2, 2026.
Building price per tsubo indicates the asking price relative to the total floor area. Shin-Okubo, Ebisu, and Meguro are in the upper 5 million yen/tsubo range, while Nishi-Nippori and Nippori are in the lower 2 million yen/tsubo range. All stations have small samples (10–39 listings) which fluctuate greatly depending on the mix of properties (age, structure, size) listed monthly. For example, Nippori dropped from 4.826 million yen/tsubo in August to 2.707 million yen/tsubo in September, likely due to changes in the characteristics of available properties.
How Different Are Yields Between East and West Sides of the Yamanote Line?

Summarizing station medians from 12-month data, the east side (Kanda to Tabata) median is 4.53%, the north side (Komagome to Otsuka) is 4.22%, and the west side (Mejiro to Ebisu) is 4.08%. The south side (Meguro to Hamamatsucho) is excluded from district comparisons since only Meguro had 10 or more listings.
| Section | Stations with 10+ Listings | Median of Median Yields |
|---|---|---|
| East side (Kanda to Tabata) | Kanda, Akihabara, Okachimachi, Ueno, Uguisudani, Nippori, Nishi-Nippori, Tabata (8 stations) | 4.53% |
| North side (Komagome to Otsuka) | Komagome, Sugamo, Otsuka (3 stations) | 4.22% |
| West side (Mejiro to Ebisu) | Mejiro, Ikebukuro, Takadanobaba, Shin-Okubo, Shinjuku, Yoyogi, Shibuya, Ebisu (8 stations) | 4.08% |
Source: Aggregated by TLL from Urbalytics sales data (building_cap_rate_stats, October 2, 2025 – October 2, 2026, excluding duplicate listings). Median of median yields for each station, not median of all properties in the section. Tabulated October 2, 2026.
The difference between east and west sides is about 45 basis points (0.45%). Monthly data for September 2026 shows a similar trend: the median yield of five east side stations (Akihabara, Ueno, Uguisudani, Nippori, Nishi-Nippori) was 4.80%, while that of four west side stations (Ebisu, Takadanobaba, Shin-Okubo, Ikebukuro) was 4.29%.
Possible reasons for this difference, which cannot be directly proven from data and are just examples of interpretation, include:
- Ratio of land price to rent: Shibuya, Ebisu, and Yoyogi have high land prices, but residential rents do not rise proportionally, leading to relatively low gross yields.
- Property composition: The eastern districts of Taito, Arakawa, and Kita wards likely have more listings of older wooden or steel-frame apartments and small buildings. Older properties priced lower tend to show higher yields.
- Buyer profile: The west side's prestigious locations attract buyers focused more on asset value than yield, enabling transactions even at lower yields.
What Has Changed From May to September 2026?
Looking at stations with 10+ listings for five consecutive months in the station report: Ikebukuro’s gross yield increased from 4.47% (May) to 4.81% (September) and building price per tsubo from 3.164 to 3.821 million yen. Komagome increased from 4.03% to 4.19%, and Takadanobaba remained about flat at 4.04% (all from Urbalytics Market Report by station).
A simultaneous rise in yield and price per tsubo is seemingly contradictory. Possible explanations include an increase in listings of commercial-use one-building properties with high rental income altering the property mix in Ikebukuro or sellers revising prices upwards. Across Tokyo, 767 one-building income properties were price-reduced in August 2026, with a median reduction of −5.0% (Urbalytics Price Reduction Watch). Station-level numbers are affected by small volumes and temporary changes; therefore, interpreting 1–2 month moves as market turns is premature.

What Owners and Investors Should Confirm
Station-specific yield market data serve as a benchmark when comparing properties. When evaluating individual properties, we recommend also confirming the following points:
- Details behind the gross yield: Whether the annual income listed is based on full occupancy or current occupancy. Comparing net yields—taking into account vacancies, management fees, and maintenance expenses—can reduce differences seen in gross yields (Difference Between Gross and Net Yield).
- Difference from station median: If the property’s yield is significantly higher than the station median, check for reasons such as the building’s age, whether reconstruction is allowed, leased land, or regulatory violations.
- Both price per tsubo and total price: Even if price per tsubo is high, small buildings may keep total price moderate. Financing conditions depend on total price and appraisal value.
- Small sample sizes: Medians derived from 10–20 listings can shift due to one listing. Review both 12-month and monthly data to verify if trends persist.
- Exit assumptions: When buying a low-yield property on the west side, consider whether it can be sold at a similar yield later (Market Outlook Based on Yield and Interest Rate Spread).
TLL handles one-building income properties across Tokyo, including the Yamanote Line area. Through our member page (free registration), you can view available properties and new listings. Our purchase support includes helping to verify if individual property yields are reasonable compared to station market levels. For the basics of selecting investment properties, see How to Choose Investment Properties.
Frequently Asked Questions
Q. Which Yamanote Line stations have the highest yields for one-building income properties?
Based on sales data from October 2025 to October 2026 with 10+ listings per station, Tabata ranked highest with 6.11%, followed by Otsuka at 5.12%, Okachimachi at 5.11%, Mejiro at 5.05%, and Uguisudani at 5.00%. These are median gross yields based on listing prices, from relatively small samples of 10 to 30 listings.
Q. Are expected yields different from gross yields?
In Urbalytics Market Reports, expected yield refers to gross yield calculated as annual income ÷ listing price. It does not consider expenses or vacancies like net yield does.
Q. Why are we missing yield data for Shinagawa and Tokyo stations?
There were very few one-building income properties listed in the past 12 months (2 at Shinagawa, 2 at Tokyo), making medians meaningless. Since the station areas are primarily office and commercial zones with few apartment or small office building listings, it is recommended to check neighboring district-level data for approximate levels.
Q. Does a higher yield on east side stations mean they are better for investment?
A higher yield only suggests prices are relatively low compared to rent. Investment quality is not determined solely by yield; factors like property age, vacancy risk, and ease of resale must be assessed on a case-by-case basis.
Summary
- The median gross yields for one-building income properties at 20 Yamanote Line stations (each with 10+ listings over 12 months) ranged from 3.40% to 6.11%, with Tabata, Otsuka, and Okachimachi highest, and Shibuya, Yoyogi, and Ebisu lowest.
- The east side (Kanda to Tabata) had a median yield of 4.53%, the west side (Mejiro to Ebisu) 4.08%, a difference of approximately 45 basis points.
- In September 2026, building price per tsubo at 11 stations ranged from 2.221 to 5.977 million yen. Monthly figures fluctuate with changing property mix, so it is safer to view them alongside 12-month data.
- When judging individual properties, verify reasons for deviation from station median, examine net yield, and consider exit strategy.
Featured image (illustration): Photo: Md Samir Sayek / Unsplash
About this article
- Author
- Chen Tan(Founder)Qualifications: Real Estate Transaction Specialist, Building Management Specialist, US Certified Buyer's Agent
TLL's founder assesses income-producing property acquisitions, repositioning and exits through market data and operating cash flow. At McKinsey & Company, he worked on strategy and digital transformation projects for financial institutions and property developers in Japan and Greater China. At Amazon Japan, he worked on the design of large-scale e-commerce products. He brings this combination of finance, real estate and technology to TLL's investment decisions and operating processes. At TLL, he oversees acquisitions, repositioning, ongoing operations and sales. Using Urbalytics price histories, rent and yield data, he examines how asking prices compare with earning potential, alongside financing terms, repair costs and exit options. His approach is to compare selling, continuing to hold and making further investments using consistent assumptions.
View profile → - Publisher
- TLL合同会社宅地建物取引業 東京都知事(1)第108202号住宅宿泊管理業 国土交通大臣(01)第F03424号
Data in this article cite their source and as-of date. Market conditions and regulations change, so check the latest information and consult a professional before deciding. Translated from the Japanese original.