Ranking of Building Price per Tsubo for Tokyo's 23 Wards Income Properties [September 2026] - Differences between Central Tokyo and Eastern/Northern Areas and Year-on-Year Comparison
Eiichi Suto (licensed real estate broker, 宅地建物取引士)Real Estate Brokerage / Renovation
18 min read
When comparing prices of entire apartment buildings or whole condominium buildings by ward, looking only at the total listing price can be misleading due to differences in building size. The "building price per tsubo" is used instead. It is the listing price divided by the total floor area (tsubo), allowing comparison of prices per the same area.
This article arranges the building price per tsubo for one-building income properties in Tokyo's 23 wards by ward, using the publicly available market report (September 2026 data) from Urbalytics, operated by TLL LLC. It reviews changes from the same month last year (September 2025) and clarifies differences between central Tokyo and eastern/northern wards. All figures are based on listing prices, not transaction prices.
Key Points of This Article
- In September 2026, the median building price per tsubo by ward for one-building income properties in Tokyo's 23 wards was highest in Minato Ward at 6.436 million JPY/tsubo and lowest in Adachi Ward at 1.666 million JPY/tsubo, a difference of approximately 3.9 times (Urbalytics market report, listing data).
- The price per tsubo in the 5 central wards (Chiyoda, Chuo, Minato, Shinjuku, Shibuya) was 5.078 million JPY/tsubo, about 2.2 times higher than the 6 eastern wards at 2.358 million JPY/tsubo, narrowing from about 2.4 times in the previous year (weighted median by ward).
- Year-on-year, Setagaya (+20.4%), Sumida (+19.3%), and Taito (+18.0%) wards showed significant increases, while Shibuya (−18.0%) and Chiyoda (−14.8%) wards declined.
Price per Tsubo Ranking of One-Building Income Properties in Tokyo's 23 Wards (September 2026)
As of September 2026, the highest building price per tsubo by ward were Minato Ward (6.436 million JPY/tsubo), Chuo Ward (5.927 million JPY/tsubo), Shibuya Ward (5.593 million JPY/tsubo), Chiyoda Ward (4.886 million JPY/tsubo), and Meguro Ward (4.298 million JPY/tsubo). The lowest were Adachi Ward (1.666 million JPY/tsubo), Edogawa Ward (2.089 million JPY/tsubo), and Nerima Ward (2.132 million JPY/tsubo). The median for all Tokyo including Tama and islands was 2.635 million JPY/tsubo.
| Rank | Ward | Sept 2026 (million JPY/tsubo) | Number of Listings | Sept 2025 (million JPY/tsubo) | Year-on-Year Change | Median Listing Price |
|---|---|---|---|---|---|---|
| 1 | Minato Ward | 643.6 | 43 | 623.5 | +3.2% | 500 million JPY |
| 2 | Chuo Ward | 592.7 | 33 | 573.6 | +3.3% | 456.5 million JPY |
| 3 | Shibuya Ward | 559.3 | 56 | 682.3 | −18.0% | 420 million JPY |
| 4 | Chiyoda Ward | 488.6 | 38 | 573.2 | −14.8% | 398 million JPY |
| 5 | Meguro Ward | 429.8 | 39 | 412.9 | +4.1% | 352.5 million JPY |
| 6 | Shinjuku Ward | 422.8 | 127 | 390.4 | +8.3% | 300 million JPY |
| 7 | Shinagawa Ward | 393.7 | 47 | 346.4 | +13.7% | 274.5 million JPY |
| 8 | Setagaya Ward | 374.5 | 138 | 311.1 | +20.4% | 250 million JPY |
| 9 | Taito Ward | 368.3 | 90 | 312.1 | +18.0% | 205 million JPY |
| 10 | Bunkyo Ward | 354.7 | 39 | 348.1 | +1.9% | 248 million JPY |
| 11 | Nakano Ward | 330.6 | 125 | 321.0 | +3.0% | 178.5 million JPY |
| 12 | Sumida Ward | 322.3 | 77 | 270.1 | +19.3% | 246.85 million JPY |
| 13 | Toshima Ward | 318.0 | 108 | 320.7 | −0.8% | 228 million JPY |
| 14 | Suginami Ward | 311.1 | 122 | 297.9 | +4.4% | 157.9 million JPY |
| 15 | Arakawa Ward | 295.9 | 64 | 282.6 | +4.7% | 220 million JPY |
| 16 | Kita Ward | 281.0 | 73 | 252.6 | +11.2% | 140 million JPY |
| 17 | Ota Ward | 264.5 | 121 | 258.8 | +2.2% | 169 million JPY |
| 18 | Koto Ward | 258.2 | 61 | 262.1 | −1.5% | 218 million JPY |
| 19 | Itabashi Ward | 223.5 | 131 | 198.3 | +12.7% | 134.8 million JPY |
| 20 | Katsushika Ward | 222.5 | 94 | 211.6 | +5.2% | 143 million JPY |
| 21 | Nerima Ward | 213.2 | 110 | 195.0 | +9.3% | 154.8 million JPY |
| 22 | Edogawa Ward | 208.9 | 93 | 187.4 | +11.5% | 158 million JPY |
| 23 | Adachi Ward | 166.6 | 117 | 181.8 | −8.4% | 153 million JPY |
Source: Urbalytics Market Report (Area-specific Tokyo ward one-building income property "listing price and area trends"). Building price per tsubo = listing price ÷ building floor area (total floor area, 1 tsubo = approx. 3.31㎡). Monthly median of all one-building income property listings collected by Urbalytics (including listed and contracted) excluding outliers by IQR method. Data compiled in September 2026 (viewed October 2, 2026).
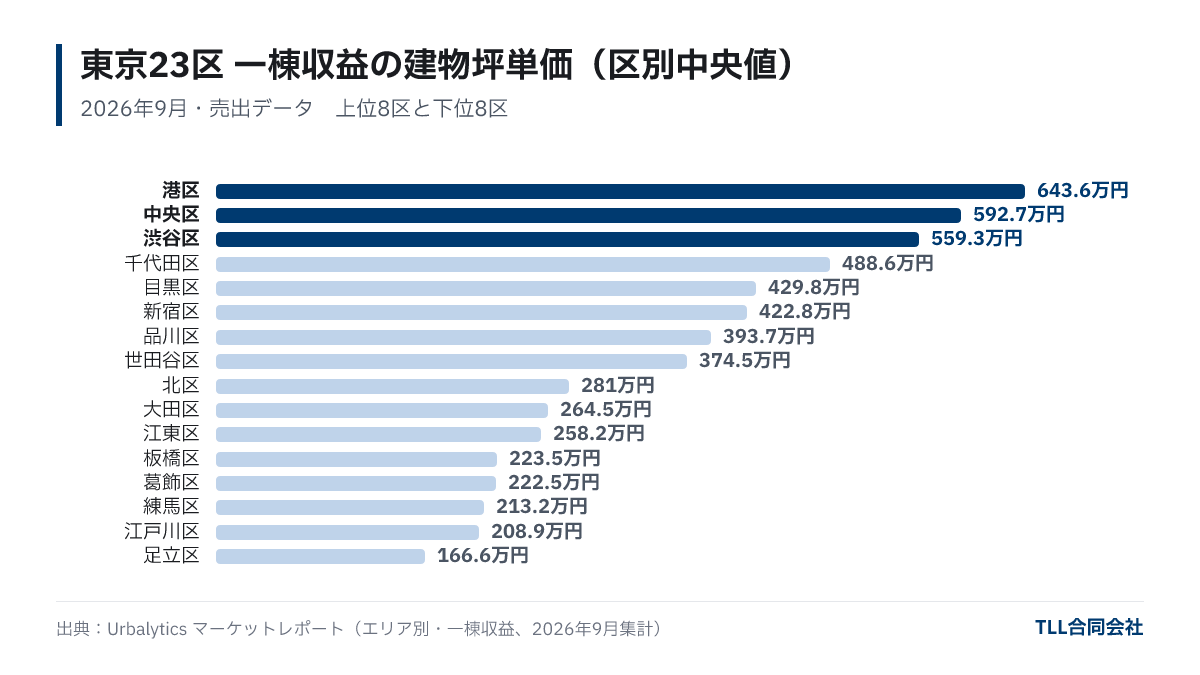
The ranking of price per tsubo generally inversely correlates with ranking by gross yield. Higher price per tsubo wards tend to have higher prices relative to rent, resulting in lower yield. Yields by ward are summarized in the "Tokyo 23 Wards One-Building Income Property Gross Yield Ranking [September 2026]".
How Big Is the Difference Between Central Tokyo and Eastern/Northern Areas?
Grouped by area, the weighted average median building price per tsubo (weighted by number of listings) in September 2026 was 5.078 million JPY/tsubo for the 5 central wards, 2.549 million JPY/tsubo for the 4 northern wards (Toshima, Kita, Itabashi, Nerima), and 2.358 million JPY/tsubo for the 6 eastern wards (Sumida, Koto, Arakawa, Adachi, Katsushika, Edogawa). Central Tokyo is about 2.2 times the eastern area and about 2.0 times the northern area.
| Area | Sept 2025 (million JPY/tsubo) | Sept 2026 (million JPY/tsubo) | Year-on-Year Change | Number of Listings (Sept 2026) |
|---|---|---|---|---|
| 5 Central Wards | 525.2 | 507.8 | −3.3% | 297 |
| 4 Northern Wards | 241.9 | 254.9 | +5.4% | 422 |
| 6 Eastern Wards | 217.3 | 235.8 | +8.5% | 506 |
| 23 Wards Total | 296.4 | 320.1 | +8.0% | 1,946 |
Source: Urbalytics Market Report (Area-specific Tokyo), median unit building price per tsubo by ward; weighted average by TLL based on data counts. This is not the overall median of the entire area. The September 2026 23-ward total matches "weighted average with 1,946 listings / 23 areas" listed on Tokyo page. Data compiled September 2026.
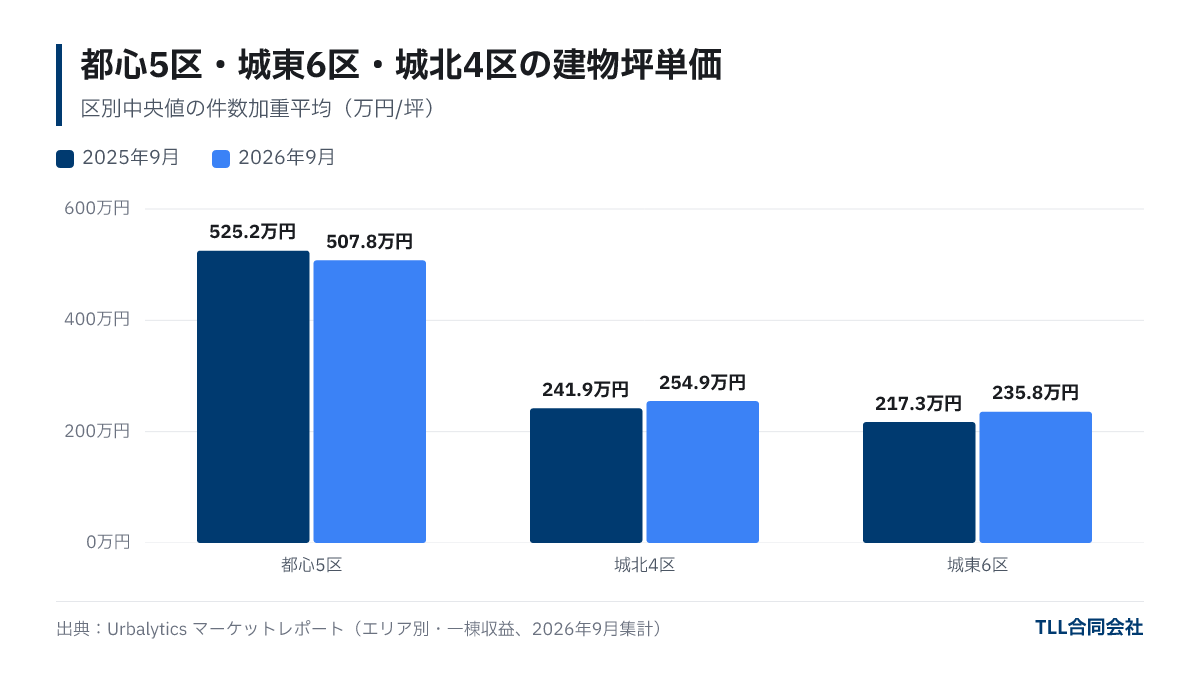
Compared to the same month last year, the 5 central wards declined by 3.3%, while the 6 eastern wards rose 8.5%, and the 4 northern wards rose 5.4%. Consequently, the price ratio between central and eastern wards narrowed from about 2.4 times to about 2.2 times. However, the decline in the central 5 wards is largely due to decreases in Shibuya Ward (682.3 → 559.3 million JPY/tsubo) and Chiyoda Ward (573.2 → 488.6 million JPY/tsubo), while Minato, Chuo, and Shinjuku wards increased.
Possible Reasons for Movement in Price per Tsubo
Wards with notable year-on-year increases include Setagaya (311.1 → 374.5 million JPY/tsubo), Sumida (270.1 → 322.3 million JPY/tsubo), Taito (312.1 → 368.3 million JPY/tsubo), Shinagawa (346.4 → 393.7 million JPY/tsubo), and Itabashi (198.3 → 223.5 million JPY/tsubo). Although it is impossible to identify exact causes from this data alone, possible factors include:
- Listing Price Increases: If sellers raise their asking prices, price per tsubo rises accordingly.
- Changes in Property Composition: A higher number of new or relatively new properties on the market tends to elevate the median price per tsubo. Rising construction costs may increase new building prices and influence resale listings (see also "How Are One-Building Apartment Appraisal Prices Determined?").
- Differences in Building Size: Since price per tsubo is calculated by dividing price by building floor area, a higher proportion of smaller buildings increases the median price per tsubo, and vice versa with larger buildings.
- Small Number of Listings: For example, Chiyoda Ward had only 16 listings in September 2025 and Chuo Ward 24, making the median volatile. Declines in Chiyoda and Shibuya may partly reflect this.
Additionally, as the price per tsubo is a building area-based metric, properties in central wards where land value is significant tend to show higher price per tsubo for smaller buildings. Thus, the difference between central and peripheral wards likely reflects primarily the land (location) value rather than the intrinsic building value.
Points for Owners and Investors to Check
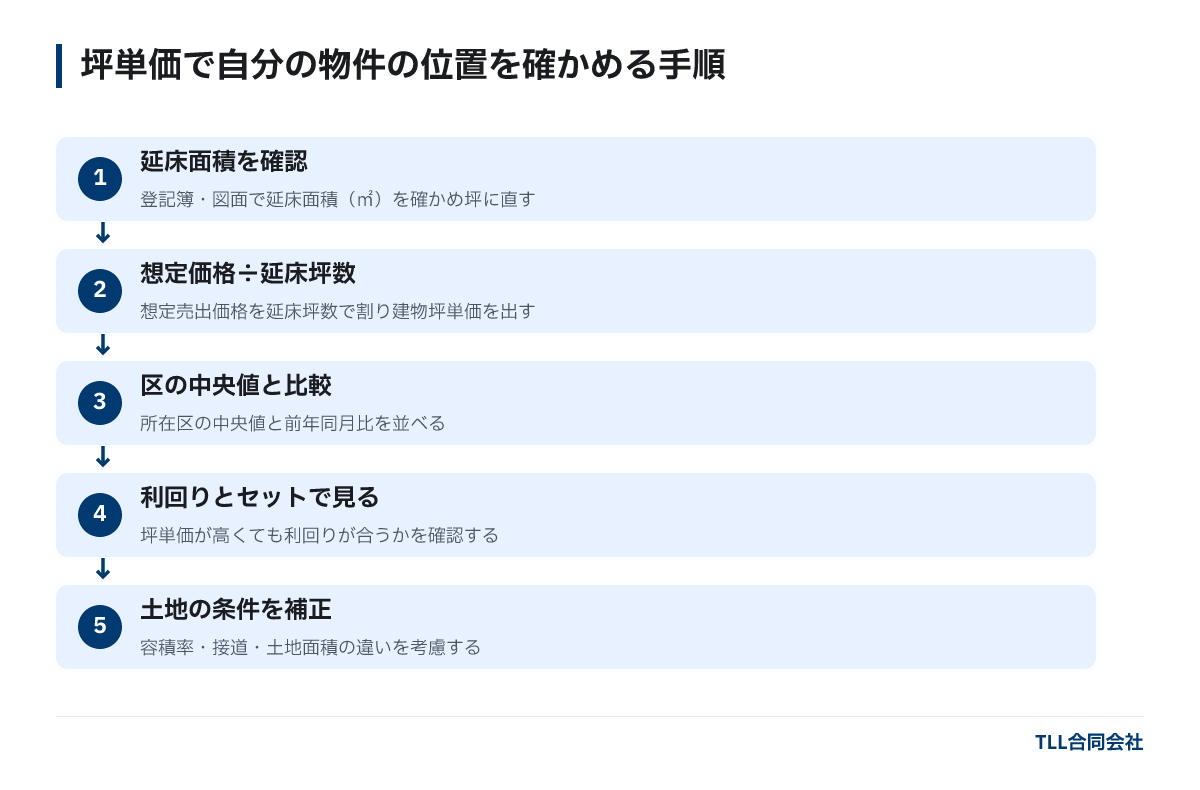
When applying the ranking of price per tsubo to your own property, check in the following order:
- Confirm total floor area: Verify the total floor area (㎡) from registry or drawings, then convert to tsubo by dividing by 3.31.
- Divide your assumed listing price by total floor area in tsubo: Calculate your property's building price per tsubo from your expected listing price.
- Compare with ward median: Check your ward's value for September 2026 and year-on-year change from the table above.
- Consider yield alongside: Even if your price per tsubo is above the median, a higher rent and resultant attractive yield can attract buyers. Avoid judging by price per tsubo alone.
- Adjust for land conditions: Floor-area ratio, road access, land size, and shape greatly affect price. Land value cannot be fully assessed by price per tsubo alone.
Ward price per tsubo serves as a market guideline, but actual prices vary depending on individual circumstances. Those considering selling can use TLL's free appraisal service to understand price considerations based on nearby listings, sales cases, and rent levels. A comparison of sales methods is explained in "Selling Whole Apartments: Direct Purchase vs Brokerage?".
Frequently Asked Questions
Q. Are building price per tsubo and land price per tsubo the same?
No. The building price per tsubo here is calculated by dividing the listing price by the building's total floor area. It differs from land price per tsubo, which divides land price by land area. Even for the same property, these figures can vary significantly.
Q. If price per tsubo rises in a ward, can we say the market price increased?
The rise may reflect higher listing prices, but also changes in property mix such as more new or smaller properties listed. It's important to consider monthly trends and number of listings together.
Q. Which sells more easily, properties in central Tokyo or in the surrounding wards?
Price per tsubo alone does not determine this. Buyers consider yield, financing availability, building condition, and other factors. It is recommended to assess individual properties with appraisal.
Summary
- The median building price per tsubo for one-building income properties in Tokyo's 23 wards in September 2026 was highest in Minato Ward at 6.436 million JPY/tsubo and lowest in Adachi Ward at 1.666 million JPY/tsubo.
- The 5 central wards stood at 5.078 million JPY/tsubo, about 2.2 times the 6 eastern wards at 2.358 million JPY/tsubo, narrowing from about 2.4 times the previous year.
- Setagaya (+20.4%), Sumida (+19.3%), and Taito (+18.0%) wards saw increases, while Shibuya (−18.0%) and Chiyoda (−14.8%) declined; but these may include influences from property composition and listing numbers.
- When comparing your property’s price per tsubo with ward medians, also review yield and land conditions.
Featured image (illustration): Photo: Ozgu Ozden / Unsplash
About this article
- Author
- Eiichi Suto(Real Estate Brokerage / Renovation)Qualifications: Real Estate Transaction Specialist, General Insurance Solicitor Qualification, Assistant Commercial Facilities Planner, Level 2 Assistant Landscape Construction Management Engineer, Level 1 Assistant Civil Engineering Construction Management Engineer
Handles sourcing, acquisition and resale planning for income-producing and commercial properties across Greater Tokyo. He has more than 25 years of real estate experience, including sales and purchase work at Nomura Real Estate Solutions and Daikyo Anabuki Real Estate. He uses his industry network across central Tokyo and the wider metropolitan area to source off-market properties and assets with repositioning potential. He holds Japan's Real Estate Transaction Specialist qualification. When assessing an acquisition, he reviews tenancy, the building and property rights, then considers refurbishment costs and the expected resale price as part of the project economics. His approach connects the purchase negotiation with what can be improved and how the property can be sold. His articles explain sales of tenanted properties and options for older buildings, leasehold interests and other challenging conditions.
View profile → - Publisher
- TLL合同会社宅地建物取引業 東京都知事(1)第108202号住宅宿泊管理業 国土交通大臣(01)第F03424号
Data in this article cite their source and as-of date. Market conditions and regulations change, so check the latest information and consult a professional before deciding. Translated from the Japanese original.