Tokyo 23 Wards Condominium Rental Price Per Square Meter Ranking [September 2026]: Areas with Notable Year-on-Year Increases and How to Interpret the Numbers
Xiao Li (licensed real estate broker, 宅地建物取引士)Sales & Property Management Lead
21 min read
“Is the rent for my apartment high or low compared to the ward’s market?” This is a common question for condominium owners renting out units, especially at each renewal or vacancy. However, simply listing total rent amounts is not a fair comparison because wards with larger average room sizes will appear more expensive.
In this article, we list the rental price per square meter (monthly rent per 1㎡) for condominiums in Tokyo’s 23 wards as published monthly by Urbalytics, based on data as of September 2026. When comparing year-on-year, all 23 wards show increases. However, the median size of listed units has significantly changed during that period, so interpreting the increase rates simply as rent hikes can be misleading. We separate rent changes from composition changes (room size shifts) and conclude with what owners should confirm for their own properties.
Key points of this article
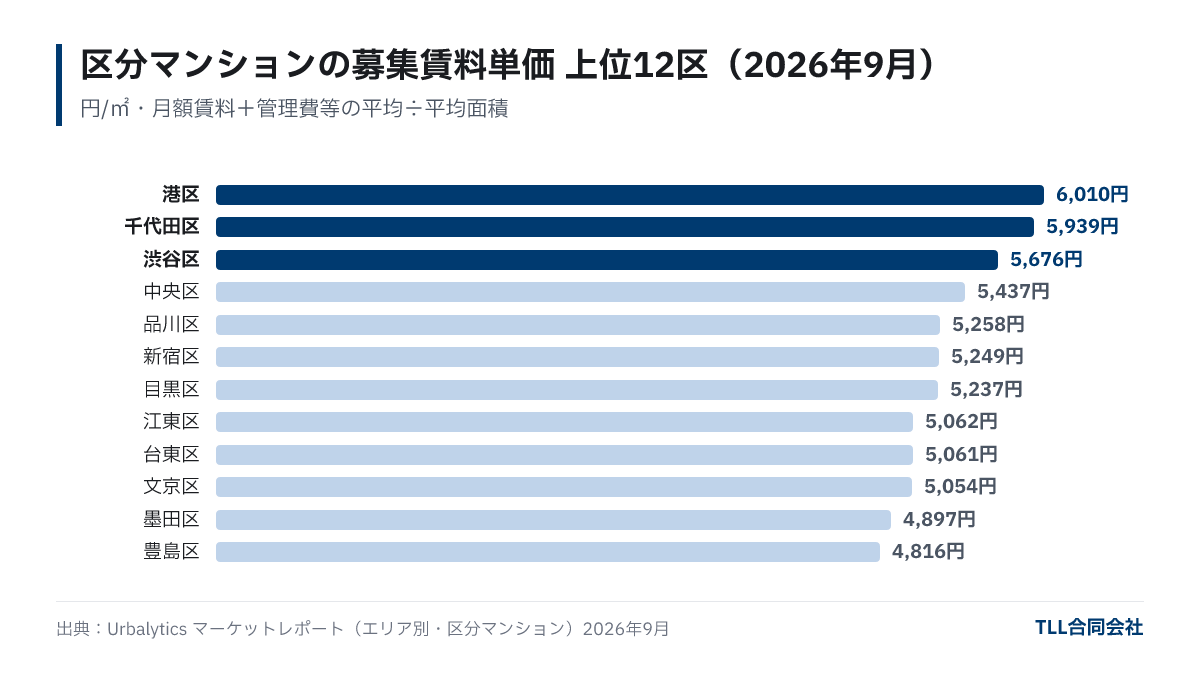
- In September 2026, rental price per square meter for condominiums in Tokyo’s 23 wards was highest in Minato Ward at 6,010 JPY/㎡, followed by Chiyoda Ward at 5,939 JPY/㎡ and Shibuya Ward at 5,676 JPY/㎡; the lowest was Edogawa Ward at 3,414 JPY/㎡ (Urbalytics Market Report).
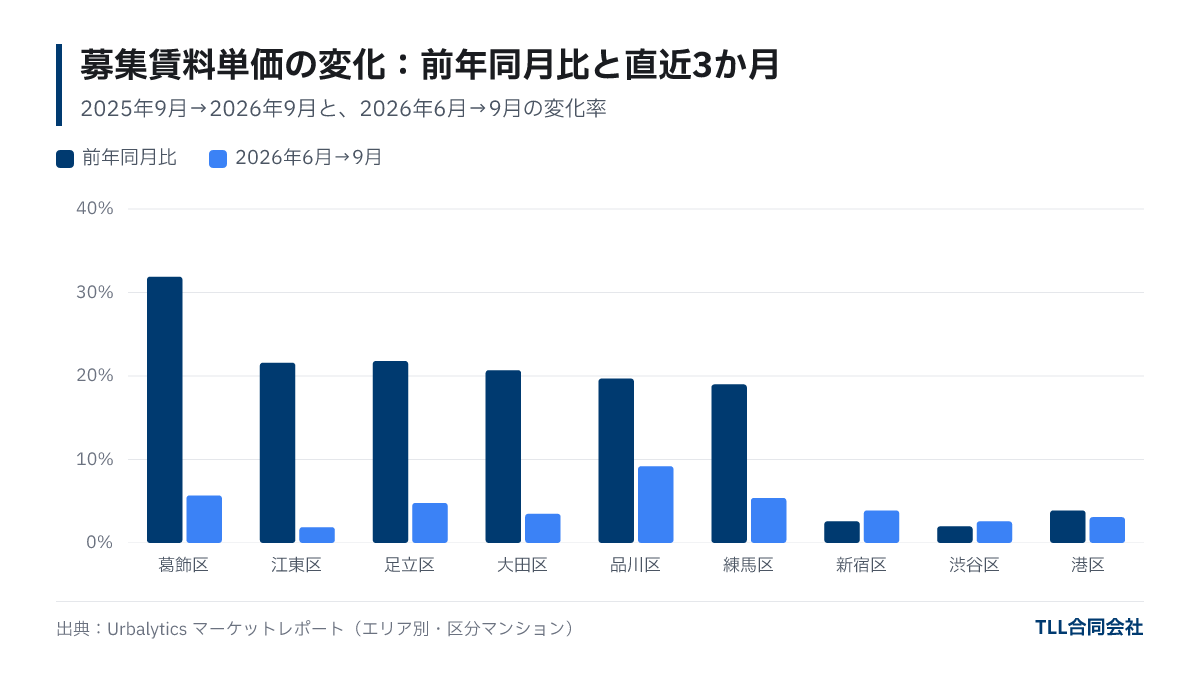
- Year-on-year increases were positive in all 23 wards, with notable rises such as Katsushika +31.9%, Adachi +21.8%, and Koto +21.6%, while median listed unit sizes shrank across all wards during the same period (e.g., Shinagawa Ward from 53.4㎡ to 26.7㎡).
- When comparing the recent 3-month period (June to September 2026) where unit sizes were stable, price per square meter changes mostly ranged from 2% to 6%, suggesting the majority of the higher year-on-year rates reflect changes in the composition of listed rooms (such as more smaller units).
Rental Price per Square Meter Ranking of Tokyo’s 23 Wards (September 2026)
As of September 2026, the highest rental price per square meter is in Minato Ward (6,010 JPY/㎡), followed by wards in the city center such as Chiyoda, Shibuya, and Chuo. The lowest is Edogawa Ward (3,414 JPY/㎡), about 1.8 times less than Minato. Converting to a 30㎡ apartment, this is roughly 180,000 JPY monthly in Minato and 102,000 JPY in Edogawa (calculated by price per square meter × area; actual rent varies depending on conditions).
The rental price per square meter here refers to the average of “monthly rent plus management fees etc.” divided by the average room size among currently listed units. This is the asking rent, not the contracted rent, reflecting the landlord’s offered price.
| Rank | Ward | Rental Price per sqm (JPY/㎡) | Year-on-Year Change | Median Listed Size (Sep 2025 → Sep 2026) | Number of Listings |
|---|---|---|---|---|---|
| 1 | Minato Ward | 6,010 | +3.9% | 58.2㎡ → 38.5㎡ | 3,027 |
| 2 | Chiyoda Ward | 5,939 | +10.3% | 53.8㎡ → 31.3㎡ | 918 |
| 3 | Shibuya Ward | 5,676 | +2.0% | 54.8㎡ → 33.3㎡ | 2,437 |
| 4 | Chuo Ward | 5,437 | +11.9% | 58.3㎡ → 40.5㎡ | 2,190 |
| 5 | Shinagawa Ward | 5,258 | +19.7% | 53.4㎡ → 26.7㎡ | 3,539 |
| 6 | Shinjuku Ward | 5,249 | +2.6% | 40.6㎡ → 28.3㎡ | 3,752 |
| 7 | Meguro Ward | 5,237 | +10.3% | 53.6㎡ → 33.0㎡ | 2,080 |
| 8 | Koto Ward | 5,062 | +21.6% | 38.9㎡ → 26.8㎡ | 3,194 |
| 9 | Taito Ward | 5,061 | +7.9% | 40.9㎡ → 34.7㎡ | 2,898 |
| 10 | Bunkyo Ward | 5,054 | +9.1% | 40.5㎡ → 35.1㎡ | 2,032 |
| 11 | Sumida Ward | 4,897 | +11.2% | 40.3㎡ → 30.1㎡ | 2,524 |
| 12 | Toshima Ward | 4,816 | +13.7% | 34.2㎡ → 27.0㎡ | 2,545 |
| 13 | Nakano Ward | 4,470 | +10.8% | 38.8㎡ → 27.6㎡ | 2,828 |
| 14 | Ota Ward | 4,395 | +20.7% | 37.3㎡ → 26.0㎡ | 3,911 |
| 15 | Setagaya Ward | 4,356 | +10.2% | 40.9㎡ → 27.7㎡ | 4,353 |
| 16 | Kita Ward | 4,253 | +10.0% | 41.9㎡ → 26.6㎡ | 2,216 |
| 17 | Arakawa Ward | 4,238 | +8.3% | 45.3㎡ → 34.1㎡ | 1,269 |
| 18 | Suginami Ward | 4,148 | +13.6% | 34.8㎡ → 25.6㎡ | 2,880 |
| 19 | Itabashi Ward | 3,974 | +16.6% | 35.2㎡ → 26.1㎡ | 2,982 |
| 20 | Nerima Ward | 3,584 | +19.0% | 38.0㎡ → 28.0㎡ | 2,369 |
| 21 | Katsushika Ward | 3,524 | +31.9% | 30.6㎡ → 25.6㎡ | 1,371 |
| 22 | Adachi Ward | 3,491 | +21.8% | 39.6㎡ → 29.2㎡ | 2,403 |
| 23 | Edogawa Ward | 3,414 | +11.2% | 50.7㎡ → 39.2㎡ | 1,804 |
Source: Urbalytics Market Report (area-specific condominium pages, e.g., Minato Ward). Data are rental listings for condominiums collected by Urbalytics as of September 2026 (viewed October 2, 2026). Rental price per sqm = (monthly rent + management fees) average ÷ average room size. Trends by ward can be viewed after free registration.
Which wards show notable year-on-year increases?
The wards with particularly large year-on-year rental price increases (September 2025 to September 2026) are Katsushika (+31.9%), Adachi (+21.8%), Koto (+21.6%), Ota (+20.7%), Shinagawa (+19.7%), and Nerima (+19.0%). Conversely, increases are small in Shibuya (+2.0%), Shinjuku (+2.6%), and Minato (+3.9%), showing a tendency for wards with originally higher prices to have smaller increases.
However, look at the second to last column of the table. The median size of listed units shrank in all 23 wards during the same year. For example, Shinagawa fell from 53.4㎡ to 26.7㎡, Minato from 58.2㎡ to 38.5㎡, Koto from 38.9㎡ to 26.8㎡, and Katsushika from 30.6㎡ to 25.6㎡.
Smaller units like studios or 1K apartments generally command higher rent per square meter than larger family-sized units. If the market shifts toward smaller units, total rent for each apartment may not have increased, but average price per square meter will appear higher across the ward. Still, the extent of size reduction and increase rates do not always align. For example, Shibuya’s median size shrank drastically from 54.8㎡ to 33.3㎡ but its increase was only +2.0%, while Katsushika’s size shrank less but increase was +31.9%. The impact of composition varies by ward, so year-on-year comparison alone does not fully capture rent dynamics.
How much of the increase is actual rent growth?
Excluding the effects of changes in unit size composition, the actual rent increase itself is considered much smaller than the year-on-year percentage suggests. There are two clues.
1. Recent 3-month change with stable room sizes
Monthly trends by ward show a large jump in unit price per sqm occurred between May and June 2026; simultaneously, the median size of listings became smaller in all 23 wards. For example, Koto Ward’s price rose about 11% from 4,478 JPY/㎡ in May to 4,968 JPY/㎡ in June, while the median size shrank from 31.6㎡ to 27.0㎡.
Since median sizes have remained virtually unchanged from June through September 2026, this period allows for comparison with minimal size composition effects. The 3-month price changes during June to September were: Katsushika +5.7% (25.8㎡ to 25.6㎡), Nerima +5.4%, Adachi +4.8%, Ota +3.5%, Minato +3.1%, Shibuya +2.6%, and Koto +1.9%. Although changes of a few percent over 3 months are not small, they are distinctly less than the 20–30% year-on-year rates.
2. Station-level rent for rooms sized 20–35㎡
Looking at Urbalytics data filtered for 20–35㎡ units listed at major stations between October 2025 and October 2026 (excluding duplicates), median price per square meter was 5,033 JPY/㎡ at Tamachi Station (Minato Ward, 177 listings), 4,776 JPY/㎡ at Toyosu Station (Koto Ward, 89 listings), 4,324 JPY/㎡ at Kita-Senju Station (Adachi Ward, 335 listings), and 3,322 JPY/㎡ at Keisei Kanamachi and Kanamachi Stations (Katsushika Ward, 159 listings). The quarterly average price per tsubo (3.3㎡) was largely flat between April–June and July–September (Toyosu 15,000→15,800 JPY/tsubo, Kanamachi 10,700→10,800 JPY/tsubo, Tamachi 16,500→17,100 JPY/tsubo, Kita-Senju 13,900→13,500 JPY/tsubo), indicating no sharp increases when room size is standardized. Note that listing numbers were low in October–December 2025, so year-on-year comparison isn’t possible here. Also, statistics include apartment units as well.
Why did these changes happen? Possible reasons
The year-on-year increase likely reflects two overlapping trends of different nature.
- Change in listing composition: Starting in June 2026, the median listing size shrank by several to over ten square meters across all 23 wards. This may be due to an increase in listings for small single-occupancy units or changes in which listings were captured in the data. It is not possible from the data alone to determine which. In any case, the year-on-year comparison for price per square meter includes large effects from changes in unit composition.
- Actual rent level increase: Even in the period of stable sizes from June to September, prices rose a few percent in many wards, indicating some upward rent pressure. The relatively large recent growth in wards with lower price levels (Katsushika, Nerima, Adachi, Edogawa) may be due to demand shifting outward from the more expensive city center, but the data cannot confirm this hypothesis.
Future rent trends will be influenced by interest rates, housing prices, new rental housing supply, and other factors. This data alone cannot predict the outlook.
What Owners and Investors Should Check
The average unit price in a ward is a starting point to evaluate if your apartment’s rent is appropriate, but should not be applied directly. Checking in this order helps reduce uncertainty:
- Compare using standardized sizes: Calculate your unit’s price per square meter by dividing rent by exclusive area, then compare not to ward averages but to listings of similar size (±5㎡) at the same station. For example, comparing a 25㎡ unit to a ward average including larger units will mislead.
- Include management fees and other costs: This article’s prices include “rent + management fees.” Align your own comparison accordingly.
- Compare listing rent and contracted rent: Listing rent is the landlord’s asking price. Rent for long-vacant units may be lower when actually agreed. Confirm recent contracted rents and vacancy durations with your property manager.
- Reassess rent at renewal or tenant turnover: If nearby listings of similar size are rising, you may have room to raise rent at turnover. Balancing rent increases against vacancy periods is important.
For measures against prolonged vacancies, see Apartment Vacancy Measures. To decide what to delegate to your management company, see How to Choose a Property Management Company. For those looking to delegate rent setting and listing conditions, see TLL’s Property Management / Asset Management service.
Frequently Asked Questions
Q. What is rental price per square meter?
It is the monthly rent plus management fees divided by the floor area of listed units. Urbalytics calculates it by dividing the average rent in each ward by the average room size. It reflects the asking rent at listing, not finalized rent.
Q. Does a 30% year-on-year increase mean rents rose 30% in that ward?
Not necessarily. The median size of listed units decreased significantly over that year, affecting the average price per square meter. When comparing the period with stable unit sizes (June to September 2026), the increase is only a few percent in most wards.
Q. How do I check if my rent is lower than the market?
Gather listings at the same station with similar size and close age, then compare price per square meter. Also, verify contracted rents and vacancy periods with your management company to understand differences from listing rents.
Q. If Minato and Edogawa wards differ by 1.8 times in price per sqm, does that mean yields differ too?
Not necessarily. Areas with higher rents often have higher property prices, so higher price per square meter doesn’t automatically mean higher yield. Condominium sale price levels by ward can be checked via the same market report’s building price per square meter data.
Summary
- As of September 2026, Minato Ward has the highest condominium rental price per square meter at 6,010 JPY/㎡, and Edogawa Ward the lowest at 3,414 JPY/㎡, about 1.8 times difference.
- Year-on-year increases are positive in all wards (e.g., Katsushika +31.9%), but median listing sizes have shrunk everywhere, so much of the increase reflects room composition changes.
- Price changes from June to September 2026 with stable room sizes are mostly 2–6%, indicating actual rent increases are smaller than year-on-year numbers suggest.
- Check your rent against listings and contracts for similar size units at the same station, not ward averages, for accurate assessment.
Featured image (illustration): Photo: Marek Okon / Unsplash
About this article
- Author
- Xiao Li(Sales & Property Management Lead)Qualifications: Real Estate Transaction Specialist, Building Management Specialist
Leads the practical work connecting investment property purchases and sales with property management after acquisition. At NTT Communications, he spent more than eight years managing digital transformation projects for major corporate clients, coordinating work from requirements through implementation and operation. He applies this experience in managing multiple stakeholders to real estate transactions and property management. He holds Japan's Real Estate Transaction Specialist and Building Management Specialist qualifications. At TLL, he oversees the property management business and handles sales strategy, investor proposals, contracts, settlement and handover. His property assessments consider rental income together with loan terms, repair costs and building age at exit, keeping purchase decisions connected to subsequent operations. His articles also cover decisions during ownership, including portfolio expansion, refinancing and management for owners living overseas.
View profile → - Publisher
- TLL合同会社宅地建物取引業 東京都知事(1)第108202号住宅宿泊管理業 国土交通大臣(01)第F03424号
Data in this article cite their source and as-of date. Market conditions and regulations change, so check the latest information and consult a professional before deciding. Translated from the Japanese original.