Used Condominium Brand Price per Tsubo Ranking [As of October 2026] Differences Among 22 Major Tokyo Metropolitan Area Brands and Points for Unit Owners Before Selling
Eiichi Suto (licensed real estate broker, 宅地建物取引士)Real Estate Brokerage / Renovation
22 min read
“Our condominium is a branded property, so it should sell for more than the market price.” This is a common phrase heard in unit condominium sales consultations. Indeed, the listing price levels differ clearly by developer brand. However, much of this difference can be explained not by the brand itself but by "where, when, and what kind of building it was constructed as."
In this article, based on Urbalytics’ brand market report, we list the median price per tsubo of 22 major condominium brands with many listings in the Tokyo metropolitan area (Tokyo and three neighboring prefectures), and analyze where the brand differences come from by examining location (percentage in Tokyo), building age, and walking distance to nearest station. Finally, we summarize points unit condominium owners should check before selling.
Key Points of This Article
- The median price per tsubo (listing price ÷ exclusive area) of 22 major brands in the Tokyo metropolitan area shows Park Court at 9.111 million yen/tsubo highest, and Arus at 2.142 million yen/tsubo lowest, a difference of about 4.3 times (Urbalytics Brand Market Report, accessed October 2, 2026).
- Even within Mitsui Fudosan, Park Court is 9.111 million yen/tsubo, Park Tower is 6.245 million yen/tsubo, Park City is 2.831 million yen/tsubo, and Park Homes is 2.349 million yen/tsubo, showing about a 3.9 times gap. This difference closely aligns with the percentage in Tokyo, building age, and whether or not the property is a tower.
- The annual median price per tsubo increased from 2025 to 2026 in 20 of the 22 brands, but since this includes changes in the composition of buildings listed, it cannot be interpreted solely as brand price appreciation.
Ranking of Price per Tsubo for the 22 Major Brands
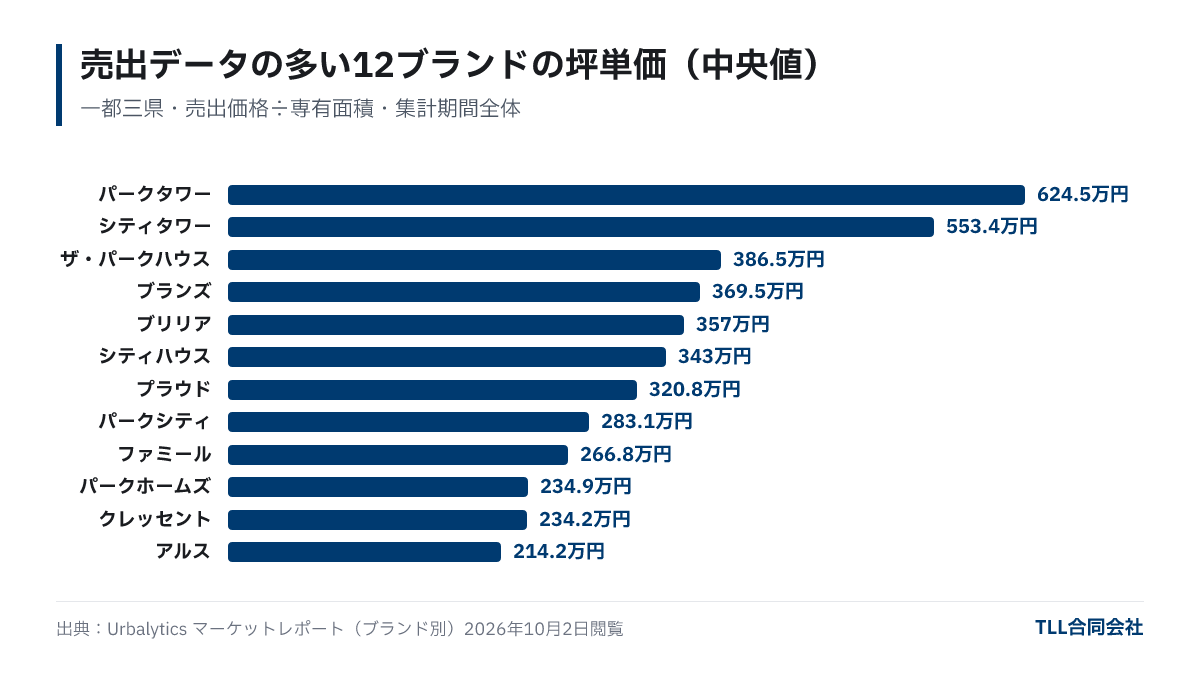
When ordering the 22 major brands with many listings (about 1,300 or more) by median price per tsubo, the top is Park Court (Mitsui Fudosan) at 9.111 million yen/tsubo, followed by Brillia Tower (Tokyo Tatemono) at 6.573 million yen/tsubo, Park Tower (Mitsui Fudosan) at 6.245 million yen/tsubo, and City Tower (Sumitomo Realty & Development) at 5.534 million yen/tsubo. The lowest is Arus (Tokyu Fudosan) at 2.142 million yen/tsubo, followed by Crescent (Morimoto) at 2.342 million yen/tsubo, and Park Homes (Mitsui Fudosan) at 2.349 million yen/tsubo.
Price per tsubo is based on the listing price divided by exclusive area, and reflects listing prices at the time of sale rather than transaction prices. Each brand’s figure is the median of all listing data captured by Urbalytics during the measurement period.
| Rank | Brand (Developer) | Median Price per Tsubo (10,000 yen/tsubo) | Interquartile Range (25%–75%) | Median Exclusive Area | Median Building Age | Average Walk to Station | Percentage in Tokyo | Number of Listings | Annual Median 2025→2026 (10,000 yen/tsubo) |
|---|---|---|---|---|---|---|---|---|---|
| 1 | Park Court (Mitsui Fudosan) | 911.1 | 543.7–1,407.3 | 76.8㎡ | 2009 | 7.4 min | 89.7% | 2,337 | 1,358 → 1,459 (+7.4%) |
| 2 | Brillia Tower (Tokyo Tatemono) | 657.3 | 391.4–905.0 | 69.9㎡ | 2021 | 4.5 min | 72.5% | 1,256 | 784 → 804 (+2.6%) |
| 3 | Park Tower (Mitsui Fudosan) | 624.5 | 397.7–878.5 | 70.7㎡ | 2013 | 5.0 min | 73.3% | 3,160 | 850 → 779 (−8.3%) |
| 4 | City Tower (Sumitomo Realty & Development) | 553.4 | 389.3–707.9 | 70.0㎡ | 2012 | 4.9 min | 69.7% | 3,952 | 660 → 676 (+2.4%) |
| 5 | Pierce (Morimoto) | 506.5 | 370.0–676.0 | 56.0㎡ | 2020 | 5.8 min | 95.8% | 1,330 | 650 → 752 (+15.8%) |
| 6 | Proud Tower (Nomura Real Estate) | 506.1 | 358.8–670.6 | 73.1㎡ | 2019 | 4.1 min | 73.8% | 2,276 | 605 → 641 (+5.9%) |
| 7 | Cleveria (Itochu Urban Development) | 399.1 | 282.4–550.0 | 67.2㎡ | 2018 | 6.1 min | 77.4% | 1,552 | 510 → 550 (+7.8%) |
| 8 | The Parkhouse (Mitsubishi Estate Residence) | 386.5 | 249.9–619.9 | 71.4㎡ | 2013 | 7.5 min | 58.8% | 8,481 | 522 → 643 (+23.1%) |
| 9 | Branz (Tokyu Fudosan) | 369.5 | 267.1–562.3 | 70.8㎡ | 2015 | 6.7 min | 56.4% | 2,478 | 472 → 600 (+27.1%) |
| 10 | Brillia (Tokyo Tatemono) | 357.0 | 249.3–543.0 | 71.6㎡ | 2014 | 6.8 min | 73.4% | 4,251 | 492 → 621 (+26.2%) |
| 11 | Grand Suite (Marubeni) | 352.6 | 219.1–548.8 | 68.0㎡ | 2009 | 6.7 min | 80.2% | 1,472 | 498 → 595 (+19.6%) |
| 12 | Premist (Daiwa House) | 349.1 | 263.8–548.6 | 70.0㎡ | 2018 | 6.4 min | 44.3% | 1,868 | 368 → 417 (+13.4%) |
| 13 | City House (Sumitomo Realty & Development) | 343.0 | 258.2–493.3 | 67.4㎡ | 2006 | 7.0 min | 73.7% | 3,657 | 412 → 531 (+28.8%) |
| 14 | Proud City (Nomura Real Estate) | 326.4 | 245.3–420.8 | 74.1㎡ | 2016 | 9.2 min | 56.0% | 1,921 | 388 → 435 (+12.2%) |
| 15 | Proud (Nomura Real Estate) | 320.8 | 241.1–490.9 | 74.0㎡ | 2013 | 6.9 min | 55.1% | 5,839 | 425 → 501 (+17.8%) |
| 16 | City Terrace (Sumitomo Realty & Development) | 287.6 | 226.8–400.7 | 70.2㎡ | 2017 | 8.6 min | 42.9% | 1,779 | 284 → 344 (+20.9%) |
| 17 | Park City (Mitsui Fudosan) | 283.1 | 208.3–529.6 | 78.0㎡ | 2003 | 8.9 min | 28.6% | 3,942 | 362 → 619 (+71.0%) |
| 18 | Famille (Marubeni) | 266.8 | 187.9–396.7 | 70.0㎡ | 1998 | 7.6 min | 49.8% | 2,924 | 289 → 225 (−22.2%) |
| 19 | Initia (Cosmo Initia) | 255.3 | 192.9–348.7 | 68.0㎡ | 2012 | 7.6 min | 58.7% | 2,199 | 293 → 358 (+21.8%) |
| 20 | Park Homes (Mitsui Fudosan) | 234.9 | 165.0–332.0 | 70.0㎡ | 2001 | 8.6 min | 41.2% | 11,699 | 257 → 312 (+21.5%) |
| 21 | Crescent (Morimoto) | 234.2 | 187.3–315.5 | 70.1㎡ | 1999 | 8.6 min | 54.3% | 3,044 | 264 → 317 (+19.8%) |
| 22 | Arus (Tokyu Fudosan) | 214.2 | 153.3–296.0 | 67.6㎡ | 1995 | 8.0 min | 49.5% | 3,849 | 236 → 264 (+11.9%) |
Source: Urbalytics Market Report (by brand. Example brand pages: Park Court, Proud). Accessed October 2, 2026. The subject includes listed condominium units (both currently for sale and already contracted) with identifiable brands in the Tokyo area (Tokyo and three prefectures). Price per tsubo and area are median values for the entire aggregation period. Annual medians are taken from each brand's "Price per Tsubo Annual Trend" page (free registration required) including listings until early October 2026. Only brands with about 1,300 or more listings are shown (rental-only brands excluded).
Where Do Brand Differences Come From?
Looking at the table, the price per tsubo differences mainly overlap three factors.
1. Percentage in Tokyo (Location)
The brands with high prices per tsubo have a high proportion of buildings in Tokyo. Park Court has 89.7%, Pierce 95.8%, Cleveria 77.4% of their properties in Tokyo. Conversely, Park City (28.6%), Park Homes (41.2%), City Terrace (42.9%), and Premist (44.3%) have many properties in Kanagawa, Saitama, and Chiba, resulting in lower price per tsubo. Comparing brands is effectively comparing where they predominantly build.
2. Building Age
Brands with median construction years from the late 1990s to early 2000s (Arus 1995, Famille 1998, Crescent 1999, Park Homes 2001) have price per tsubo remaining in the 2 million yen range. Generally, even within the same brand, older buildings tend to have lower listing prices.
3. Whether It’s a Tower and Station Distance
Tower-type brands like Brillia Tower, Park Tower, City Tower, and Proud Tower have a short average walking distance to the station of around 4.1 to 5.0 minutes and price per tsubo concentrated above 5 million yen. Large suburban properties like Park City and Proud City have longer average station walks of 8.9 and 9.2 minutes.
Price per Tsubo Differs Nearly 4 Times Even Within the Same Developer
Comparing the four Mitsui Fudosan brands shows Park Court at 9.111 million yen/tsubo, Park Tower at 6.245 million yen/tsubo, Park City at 2.831 million yen/tsubo, and Park Homes at 2.349 million yen/tsubo, with about 3.9 times difference between the highest and lowest. Similarly, Sumitomo Realty & Development shows City Tower at 5.534 million yen/tsubo versus City Terrace at 2.876 million yen/tsubo; Nomura Real Estate's Proud Tower at 5.061 million yen/tsubo versus Proud at 3.208 million yen/tsubo, demonstrating significant variation by series.
In other words, it is inaccurate to say "it’s expensive because it’s a large developer’s property." When considering sale price, the brand series and within that series, the location and building age position, are more important than developer name alone. Even within the same Park Homes brand, there can be nearly a two-fold price difference (interquartile range 1.65 to 3.32 million yen/tsubo) between newly built properties in central Tokyo and older properties in suburban areas.
What Changed from 2025 to 2026?
Comparing each brand’s annual median price per tsubo for 2025 and 2026 (up to early October), 20 of 22 brands rose. Brands with large increases include City House (+28.8%), Branz (+27.1%), Brillia (+26.2%), The Parkhouse (+23.1%), and Park Homes (+21.5%), while Famille (−22.2%) and Park Tower (−8.3%) declined.
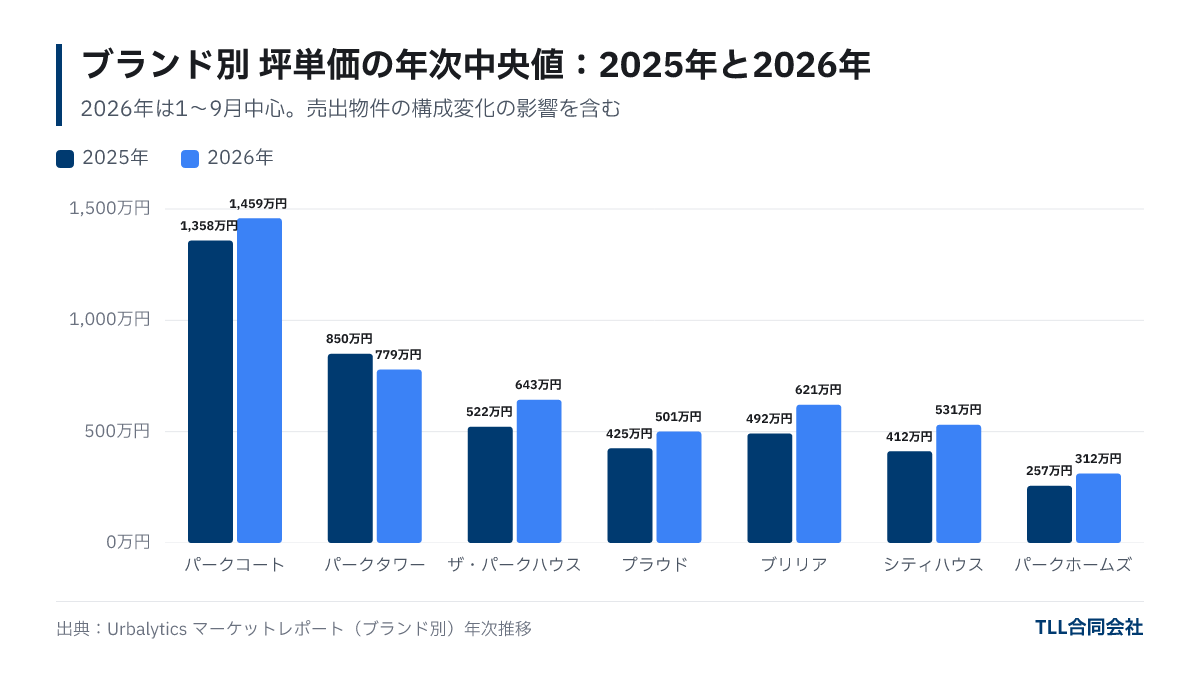
However, these figures do not reflect what percentage the same room’s price has increased. Since the composition of buildings offered for sale changes annually, years with more central Tokyo or newer buildings being listed will raise the median, and years with more suburban or older properties will lower it. Large changes such as Park City’s +71.0% (3.62 million → 6.19 million yen/tsubo) likely reflect significant differences in the location and age composition of properties offered compared to the previous year, so interpreting this as overall brand price movement is not appropriate.
Moreover, Urbalytics’ area-specific report shows the median price per square meter of unit condominiums in Tokyo’s 23 wards (weighted by volume by TLL) rose from 1.238 million yen/㎡ in September 2025 to 1.437 million yen/㎡ in September 2026, which may be one factor behind many brands’ annual median price increases. Future price trends are affected by interest rates and supply, and cannot be predicted from this data.
What Unit Owners Should Check Before Selling
Brand price per tsubo is a useful reference for estimating your room’s price, but setting the listing price solely on this is risky. Before selling, check the following points.
- Listings and transactions within the same condominium: The closest comparison is other units in the same building. Adjust for differences in floor level, direction, and size. Be careful that competing listings within the same building may lead to price competition.
- Position within the brand: Determine where your property falls within the brand’s price quartiles by location (ward and station) and building age. Central, newer properties tend to be at the higher end; suburban, older ones at the lower end.
- Area price levels: Compare the price per square meter of all unit condominiums in the same ward or station area to understand how much premium the brand adds. Area levels can be viewed in Urbalytics Area Reports.
- Management and repair conditions: Buyers care about building management, repair reserve balance, and upcoming major repairs more than brand. Review the Important Matters Investigation Report in advance.
- Net proceeds estimate: Judge based on net proceeds after subtracting broker fees and capital gains tax from the sale price. Fee considerations are explained in Real Estate Sales Brokerage Fees, and taxes in Long-term vs. Short-term Capital Gains Tax.
If you want to know your unit’s potential sale price considering brand, location, and building age, please use TLL’s free appraisal.
Frequently Asked Questions
Q. Do branded condominiums sell for higher prices than non-branded ones?
The high price per tsubo seen in branded properties is largely due to a concentration of central, near-station, newer buildings. Price increase cannot be attributed to brand alone. It is more realistic to compare management condition and specifications relative to similar location and age properties.
Q. How do you convert between price per tsubo and price per square meter?
One tsubo is approximately 3.31 square meters, so multiply price per square meter by 3.31 to approximate price per tsubo. Urbalytics reports brand prices per tsubo and area reports for unit condominiums per square meter.
Q. If a brand’s annual price per tsubo rose over 20%, did my unit’s price rise 20% too?
Not necessarily. Annual median prices are influenced by which buildings were listed that year. To check your unit’s price change, compare listings and transactions for the same or similar units.
Q. Is the data based on listing prices or transaction prices?
The data is based on listing prices (including those currently listed and contracted at listing). Actual transaction prices may be lower due to negotiation.
Summary
- The median price per tsubo among 22 major brands in the Tokyo metropolitan area ranges approximately 4.3 times from Park Court at 9.111 million yen/tsubo to Arus at 2.142 million yen/tsubo (as of October 2, 2026).
- Most of this difference overlaps with percentage in Tokyo, building age, tower designation, and station walking distance, and within Mitsui Fudosan alone, series vary by about 3.9 times.
- Annual median prices rose for 20 of 22 brands from 2025 to 2026, yet this includes changes in listed buildings and cannot be read as pure price increases.
- Before selling, checking listings within the same building, your position within the brand, area price levels, management condition, and net proceeds sequentially makes judgment easier.
Featured image (illustrative): Photo: Levi Meir Clancy / Unsplash
About this article
- Author
- Eiichi Suto(Real Estate Brokerage / Renovation)Qualifications: Real Estate Transaction Specialist, General Insurance Solicitor Qualification, Assistant Commercial Facilities Planner, Level 2 Assistant Landscape Construction Management Engineer, Level 1 Assistant Civil Engineering Construction Management Engineer
Handles sourcing, acquisition and resale planning for income-producing and commercial properties across Greater Tokyo. He has more than 25 years of real estate experience, including sales and purchase work at Nomura Real Estate Solutions and Daikyo Anabuki Real Estate. He uses his industry network across central Tokyo and the wider metropolitan area to source off-market properties and assets with repositioning potential. He holds Japan's Real Estate Transaction Specialist qualification. When assessing an acquisition, he reviews tenancy, the building and property rights, then considers refurbishment costs and the expected resale price as part of the project economics. His approach connects the purchase negotiation with what can be improved and how the property can be sold. His articles explain sales of tenanted properties and options for older buildings, leasehold interests and other challenging conditions.
View profile → - Publisher
- TLL合同会社宅地建物取引業 東京都知事(1)第108202号住宅宿泊管理業 国土交通大臣(01)第F03424号
Data in this article cite their source and as-of date. Market conditions and regulations change, so check the latest information and consult a professional before deciding. Translated from the Japanese original.