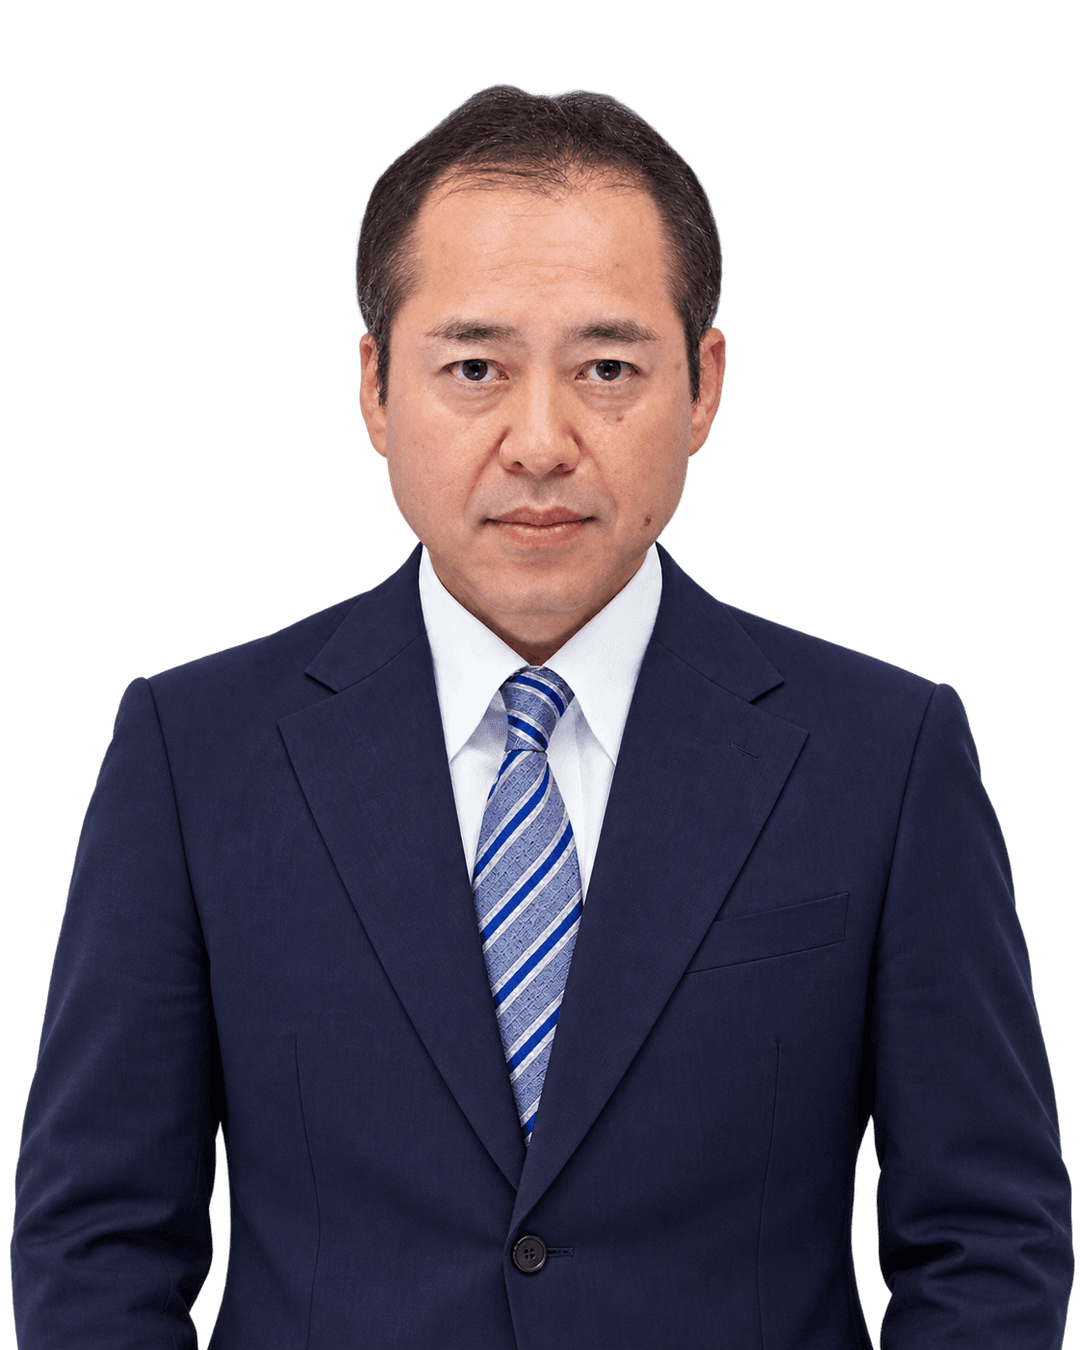
Eiichi Suto

Eiichi Suto

Real Estate Brokerage / Renovation

Handles sourcing, acquisition and resale planning for income-producing and commercial properties across Greater Tokyo.

Overview

He has more than 25 years of real estate experience, including sales and purchase work at Nomura Real Estate Solutions and Daikyo Anabuki Real Estate. He uses his industry network across central Tokyo and the wider metropolitan area to source off-market properties and assets with repositioning potential. He holds Japan's Real Estate Transaction Specialist qualification. When assessing an acquisition, he reviews tenancy, the building and property rights, then considers refurbishment costs and the expected resale price as part of the project economics. His approach connects the purchase negotiation with what can be improved and how the property can be sold. His articles explain sales of tenanted properties and options for older buildings, leasehold interests and other challenging conditions.

Experience & education

Professional Experience

Nomura Real Estate Solutions Co., Ltd.

Daikyo Anabuki Real Estate

Education

Kokushikan UniversityFaculty of LawDepartment of Law

Certification

Real Estate Transaction Specialist

General Insurance Solicitor Qualification

Assistant Commercial Facilities Planner

Level 2 Assistant Landscape Construction Management Engineer

Level 1 Assistant Civil Engineering Construction Management Engineer
TLL Columns

Articles on Urbalytics

Rental property acquired within five years: What proposed inheritance valuations mean for Tokyo owners

Rental property acquired within five years: What proposed inheritance valuations mean for Tokyo owners

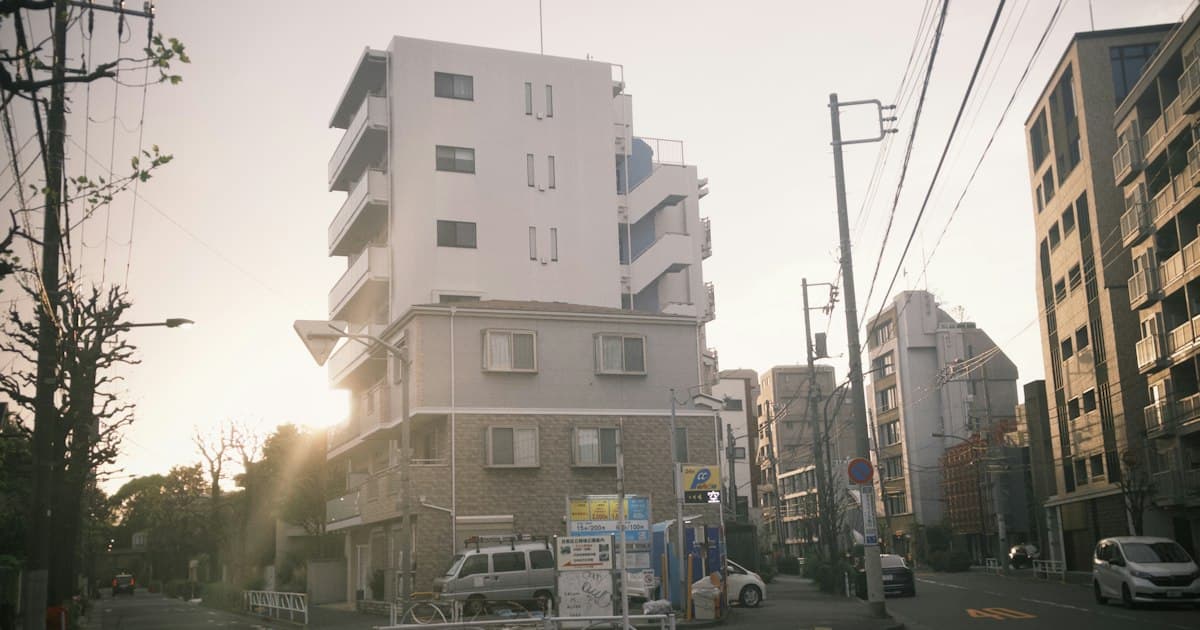
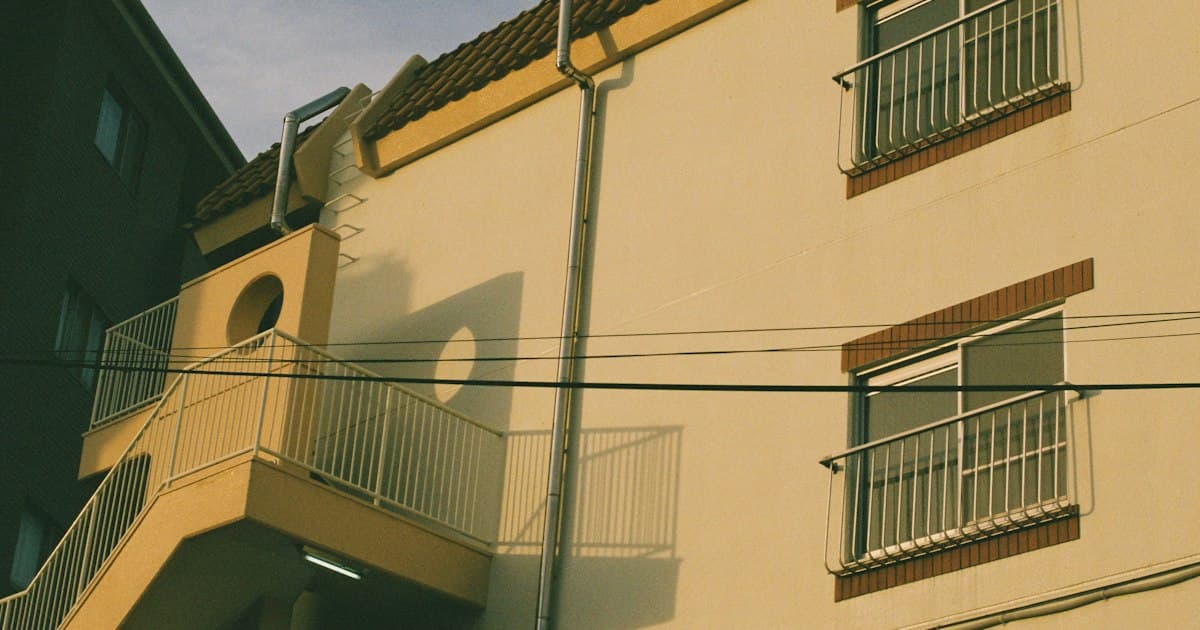
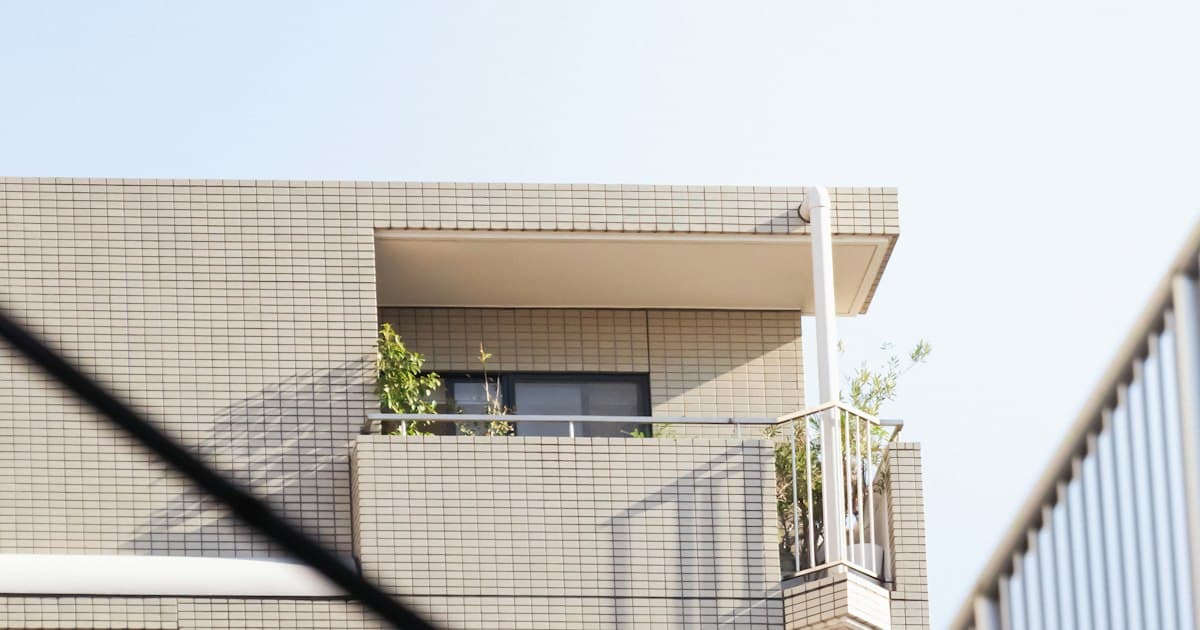
A proposal to bring inheritance-tax valuations of rental property closer to market prices means owners in Greater Tokyo should revisit the tax-saving assumptions in their acquisition plans.On October 22, Kenbiya reported on the National Tax Agency’s draft valuation guidance for rental property. The proposal would, in principle, value rental real estate acquired for consideration or newly constructed within five years before the tax valuation date at its normal transaction value. Where specified conditions are met, it would allow an amount based on acquisition cost, adjusted and then multiplied by 80%.This affects a familiar reason for buying rental buildings: converting cash into property to reduce the value of an estate for tax purposes through the gap between purchase price and tax valuation. Buyers in Tokyo, Kanagawa, Saitama and Chiba who have included that benefit in their acquisition plans need to re-examine its basis.As of October 22, the documents verified for this article remain a draft. e-Gov shows that public consultation closed on October 18. The draft envisages application to assets acquired by inheritance, bequest or gift on or after January 1, 2027. The close of consultation does not mean the wording has been finalized.Two checks before applying the 80% calculationThe draft first requires the acquisition price to be recognized as the normal transaction value at the time of acquisition. It then treats land and buildings separately. Land cost is adjusted by a land-price change factor; the building cost is reduced by the prescribed depreciation or reduction amount. Each adjusted amount is then multiplied by 80%.Simply multiplying the entire purchase-contract price by 80% therefore does not produce a valuation valid at any date. The allocation between land and building, delivery date and subsequent improvement costs may also affect the calculation. The draft generally uses delivery to determine the acquisition date, with exceptions covering exchanges, compulsory acquisition and certain buildings constructed on previously owned land.The five-year period is measured backwards from the tax valuation date to acquisition. It does not restart when the proposed rules take effect. Buyers preparing to sign should ask their tax adviser to check the actual delivery date rather than rely on statements such as “bought this year” or “held for more than five years.”Figure 1 | Residence Nakano-sakaue, photographed on December 5, 2023. Photo: 鋸香具師 / Wikimedia Commons, CC0, unmodified. An illustration of multifamily housing.A change in tax valuation does not increase rental incomeFor owners seeking long-term rental income, lettability and maintenance costs still determine operating performance. A change in tax valuation mainly changes the calculation used when assets are transferred; it does not simultaneously increase the rent arriving in the owner’s bank account.The effect is more direct for buyers who accepted a lower operating return in the expectation that tax savings would make up the difference. If that benefit shrinks without a corresponding adjustment in purchase price, the overall investment may become less attractive. Sellers also need to explain leases and property condition rather than emphasize only the valuation discount available under previous assumptions.This mechanism does not establish that market prices have already fallen. The final guidance and any changes to buyers’ offers will need to be assessed against subsequent transaction evidence. Our earlier analysis of Tokyo investment-condominium and whole-building prices examined the different price measures used for different asset classes; tax analysis likewise needs to address the specific property.Fractional real estate products are treated separately in the draft. This article’s discussion of directly held rental buildings should not be applied wholesale to those products. Holding property through a company and inheriting its shares also raises separate share-valuation questions; conclusions for direct personal ownership cannot simply be transferred to that structure.Use Nakano market samples to assess operations separatelyTo illustrate the range of market evidence used in rental-housing underwriting in Greater Tokyo, we selected samples within a 15-minute walk of Nakano Station in Tokyo. They show how rents and acquisition yields should be checked separately, not that Nakano would be more affected by the proposal.Urbalytics recorded 536 residential rental listings for units of 20–40 m². Median base rent was ¥125,000 per month, with a lower quartile of ¥90,000 and an upper quartile of ¥148,250. This distribution can help owners identify comparable asking rents within the same size band, then narrow the comparison by age and equipment. It does not establish that their own unit can achieve the median rent.A separate sample of whole-building listings and price revisions contained 40 records after deduplication. Median gross asking yield was 4.45%, with a lower quartile of 4.07% and an upper quartile of 5.28%. These figures prompt further checks on whether advertised annual income assumes full occupancy and how much remains after operating costs. They are not appraisals of normal transaction value for tax purposes.Panel A | Base monthly rent (¥10,000 per month): lower quartile 9, median 12.5, upper quartile 14.825. Residential units of 20–40 m² within a 15-minute walk of Nakano Station, Tokyo; n=536. Observation window: 2025-10-23 to 2026-10-22 (UTC).Panel B | Whole-building gross asking yield (%): lower quartile 4.07, median 4.45, upper quartile 5.28. Within a 15-minute walk of the same station; n=40 after deduplication, over the same window. Before operating and financing costs.The two samples are independent. Multiplying unit rents by an assumed number of units, then combining that result with whole-building prices from a different sample, would not create a valid “representative rental building.” Actual acquisition analysis must return to the target property’s leases, vacancies and expenses. For area context, see the Nakano Ward whole-building market report and the Tokyo market report.Methodology: queried on October 22, 2026, with the location restricted to Tokyo. Rent figures use currently stored base asking rents for residential listings first observed between 2025-10-23 and 2026-10-22 (UTC), for units of 20–40 m² within a 15-minute walk. The scan limit was not reached. Management fees and other charges are excluded; these are not agreed rents. The whole-building sample uses properties with listing or price-revision records in the same window, excludes completed-sale records and private valuations, and merges duplicates appearing under multiple stations. Gross yield is advertised annual income divided by asking price, before operating and financing costs. This cross-sectional distribution does not measure price changes before and after the policy.Start with the tax assumptions in the acquisition planFamilies that already own rental buildings can organize the delivery dates and land/building price allocations for each acquisition, then ask their tax adviser whether the draft applies and whether any exceptions are relevant. If the original plan contains an inheritance-tax estimate, identify which version of the rules it uses rather than retain only an “expected tax saving.”Buyers considering an acquisition should first check whether existing leases support their offer without relying on an uncertain tax benefit. Renovation plans also need their own appraisal, so that future rent increases and previously assumed tax savings are not both counted as certain gains.Figure 2 | Belte Nakano Egota, photographed on June 18, 2023. Photo: Asanagi / Wikimedia Commons, CC0, unmodified. This is not a property in the statistical sample or an individual tax case.The next documents to watch are the National Tax Agency’s final guidance and transitional arrangements. Once finalized, use the same property information to update the tax calculation and compare it line by line with the original acquisition plan. If the change is material to the offer price, record the revised reasoning before delivery.Cover and body photo 1: Residence Nakano-sakaue, December 5, 2023; 鋸香具師 / Wikimedia Commons, CC0, unmodified. Body photo 2: Belte Nakano Egota, June 18, 2023; Asanagi / Wikimedia Commons, CC0. The photographs illustrate multifamily housing in Tokyo; they do not identify properties in the statistical samples or individual cases to which the draft applies.Tags#JapanRentalProperty #InheritanceValuation #InheritanceTax #RentalRealEstate #FiveYearRule #NationalTaxAgency #TokyoPropertyInvestment #Nakano #WholeBuildingInvestment #RentalMarket #GrossYield #UrbalyticsReferencesKenbiya, October 22, 2026: report on the draft rental-property valuation guidance.National Tax Agency / e-Gov, September 18, 2026: case 410080055, summary, and full draft.Urbalytics: Nakano Ward whole-building market report, September 2026 monthly page. The separate station-area queries used in this article are defined in the methodology above.Wikimedia Commons: Residence Nakano-sakaue photograph and license; Belte Nakano Egota photograph and license.
When the Crocodile’s Mouth Opens: Tokyo resale condo asks keep climbing while closings stall

When the Crocodile’s Mouth Opens: Tokyo resale condo asks keep climbing while closings stall

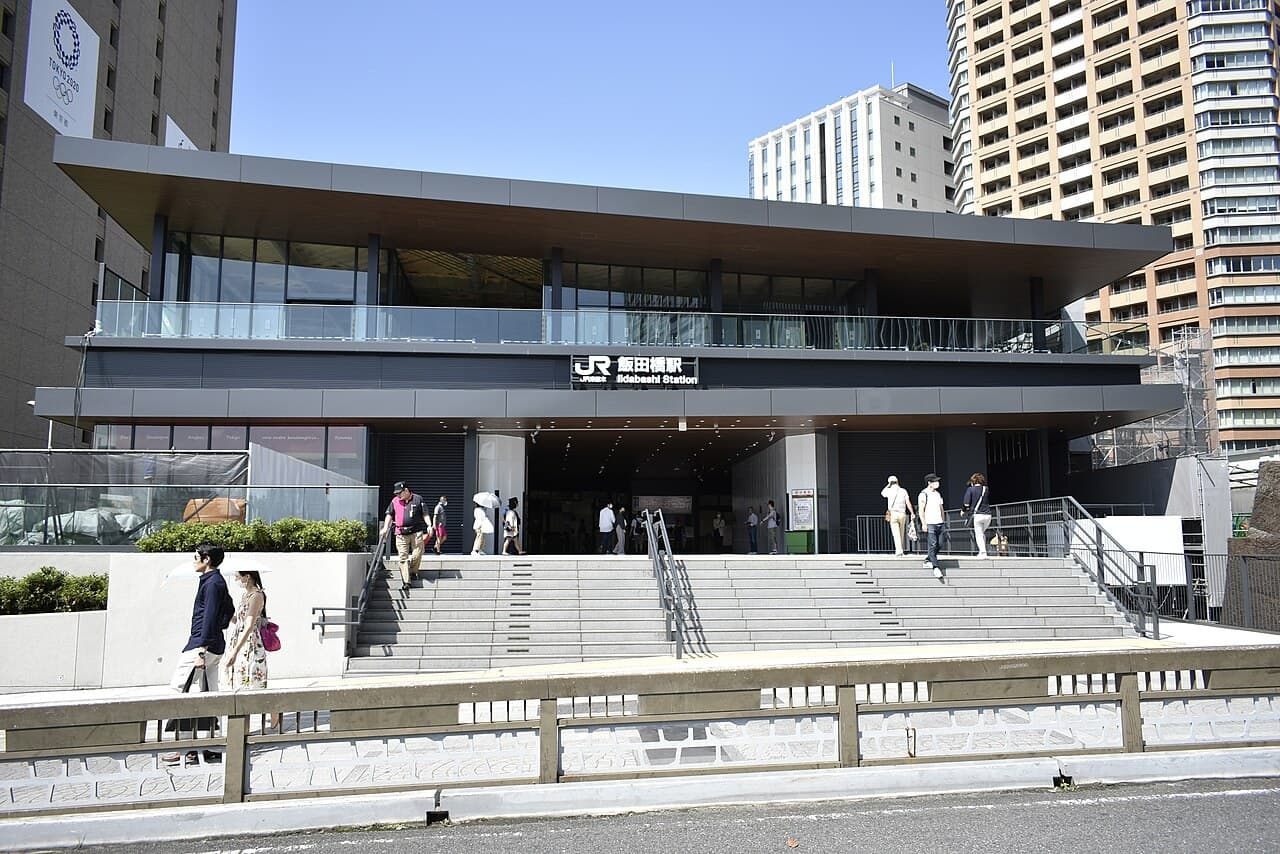
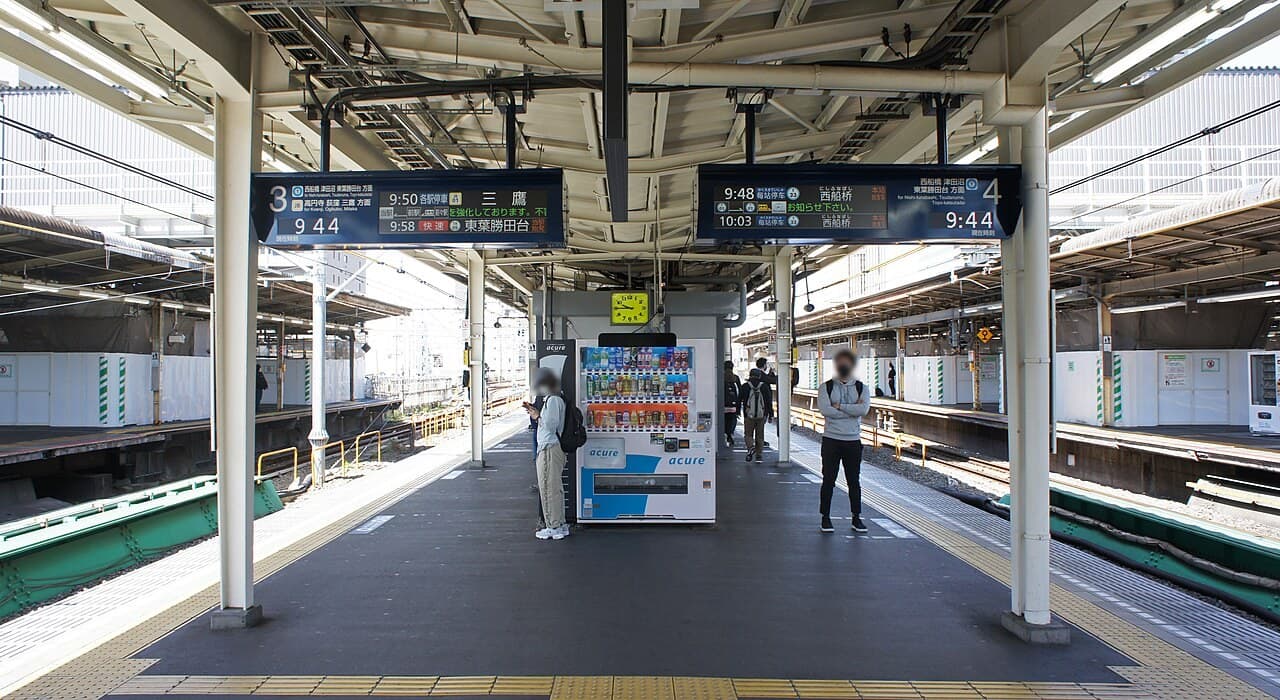
The average asking price for resale condominiums in Tokyo’s 23 wards has surpassed 130 million yen, but buyers’ borrowing capacity is being eroded by higher interest rates, tearing the spread open into a crocodile’s mouth.On the morning of October 2, at a brokerage’s morning meeting in Iidabashi, Head of Sales Tomoko Azuma shared a signal: a client had just cut their ask by roughly 10 million yen in one go. In a capital-region market that for years only moved prices up, that sentence alone was telling.Even clearer was the chart she showed next—closed transactions have been down year over year since early this year, while the blue bars for inventory have marched higher. As the two lines diverge, the industry has a name for the shape: “Wani no Kuchi” (crocodile mouth).Iidabashi Station, station frontThe crocodile’s upper jaw: asking prices are still anchored in the old worldThe upper jaw is the seller’s price. In August 2026, the average ask per unit for resale condos in Tokyo’s 23 wards was about 130 million yen—the product of a decade-long one-way climb and the psychological anchor it created for sellers.The problem is that this anchor is calibrated to “what sold last year.” When the market turns, the ask is the slowest price to respond—because it doesn’t require a counterparty’s agreement; one person can post it.The lower jaw is what buyers can actually pay, and that line is set by banks, not by sentiment. As the gap between the two widens, deals naturally get stuck in the middle.Masakatsu Nakane, Head of Operations at a brokerage, put it plainly: “Unless prices come down further, supply and demand won’t line up.” This isn’t a weak market so much as a temporary breakdown in price discovery.The crocodile’s lower jaw: every 0.5% move in rates costs you a car’s worth of down paymentPushing the lower jaw down are mortgage rates after consecutive Bank of Japan hikes. A simple scenario cited in reporting is intuitive: for a household earning 7 million yen a year taking a 35-year mortgage, a 0.5 percentage point rise in rates cuts the bank’s lending cap from 56.46 million yen to 52.70 million yen.Nearly 4 million yen of capacity evaporates without the buyer even noticing. For end-users, this isn’t “whether to buy,” but “whether the bank will allow you to buy.”That same day, commentary around the BOJ’s Tankan echoed the point—“If interest rates continue to rise, the burden will become heavy.” Pressure on buyers and on holders are two sides of the same coin.Real estate journalist Atsushi Sakaki went further: “This means the real demand cohort relying on mortgages has already exceeded its capacity to pay.” He added that circulation in resale listings is getting heavier and beginning to stick.Evidence in the numbers: the list-to-sale spread widened to 6.22%This isn’t just on-the-ground anecdote. A Tokyo Kantei report published July 30, 2026 shows the capital region’s price divergence (ask vs. closing) at -6.22% in 2H 2025, widening from -6.14% in the prior period.A wider divergence means sellers are conceding more from ask to close. The report points to one segment in particular—nearly-new stock that’s almost indistinguishable from new builds—many of which were set at “overly ambitious ‘challenge’ prices.”The more aggressive the ask, the longer the path to closing. That’s why, in the same market, some listings sell in three weeks while others keep cutting for half a year.Azabu-Juban streetscapeWhy Minato Ward has become a cluster of “risky stations”Money Post Web, working with big-data firm Estate Technologies, ranked stations in the capital region by year-over-year deterioration in days-on-market to produce a list of “risky stations.” Minato Ward accounts for seven stations in the top 50: Mita, Shiodome, Roppongi-itchome, Azabu-Juban, Akasaka, Roppongi, and Tamachi.Atsushi Sakaki explains that Minato has long had many sellers posting “challenge” prices. He also cautions that when a station has few transactions, a handful of slow cases can skew the deterioration rate—so don’t avoid an area just because it appears in a ranking.From Urbalytics platform data, Minato’s real structural issue isn’t days-on-market but yield itself. Over the past 15 months, the median gross yield for whole-building assets around Azabu-Juban Station was just 2.90%, versus 3.45% around Iidabashi and 3.83% around Tamachi (the latter two have fewer samples and are for reference).A 2.9% gross yield leaves almost no safety cushion with mortgage rates rising. Either rents catch up, or prices come down—there’s no third path.Data source: UrbalyticsUrbalytics Insight Data posted on Urbalytics show that the average price per tsubo for whole-building assets in the Azabu-Juban station area fell from about 10.04 million yen/tsubo in Q3 2025 to about 7.56 million yen/tsubo in Q4 2026, a decline of nearly 25%. Over the same period, asking rents per tsubo fell from 23,700 yen/tsubo·month to 19,000 yen/tsubo·month. Weakness in both prices and rents indicates the adjustment here isn’t just about liquidity; the pricing benchmark itself is being reset.Not a broad stall: outer-ring stations are catching demand pushed outThe widest crocodile mouths are exactly where unit prices are highest. That doesn’t mean the entire capital region is stalling; demand is being reallocated by higher rates.Another data point the same day offers a contrast: in Nifty Real Estate’s 2026 station ranking, stations along Tobu Railway in southeastern Saitama jumped by as many as 12 places, with Omiya taking the top spot with a relative score of 100.0, driven by “through-service to the city center” and family-friendly environments.This is no accident. When total prices in the 23-ward core shut out end-users, those budgets don’t disappear—they migrate along through-service lines to station areas where the commute is 15–20 minutes longer but total price is a full tier lower.For investors, that migration path is more worth tracking than “where will fall.” Cooling in high-price core assets and warming in outer-ring stations can coexist in the same quarter. Using a citywide average chart to time buys and sells will inevitably misread one side.The overlooked third hand: another reason listings don’t move is renovationThe second chokepoint Sakaki highlights rarely shows up in macro data but tangibly blocks deals: renovation (reform) can’t get done.Rising materials and labor costs have pushed up both new-build prices and renovation quotes, while contractors are trapped between higher costs and acute labor shortages, with backlogs they can’t clear. More critically, renovate-and-resell operators have long locked in contractor capacity, so individual sellers often can’t get on the schedule.He estimates the magnitude as: renovation quotes are 3–4 times higher than a decade ago. Partial upgrades run 5–6 million yen; full-gut renovations often exceed 10 million yen.That leaves ~20-year-old stock in the toughest spot:First, sell as-is and buyers will compare it with freshly renovated comps in the same area, concluding, “If it’s only 2–3 million more, of course I’ll take the renovated one,” leaving as-is units to stagnate.Second, try to renovate but can’t secure a contractor, or the quote eats all expected profit—effectively taking a loss before listing.Third, sell to a renovate-and-resell operator for convenience; the offer is usually deeply discounted, effectively handing over the entire renovation profit plus a risk premium.Tamachi Station platformRisk warning For cross-border investors, the easiest misread in this phase is confusing “asking price” with “achievable closing price.” Most prices on public portals still reflect the upper-jaw level, with an average gap of about 6%—and larger in individual cases—to where deals actually sign. If you back into yields from asks, you will systematically overstate returns; for ~20-year-old, unrenovated stock, add an extra allowance for underappreciated renovation cost and scheduling risk.How the crocodile mouth will closeShinji Fukushima, Head of Data Analysis at Mansion Research, offers a measured path: no one will keep pricing at levels that don’t sell, so further rises in closing prices are unlikely; more likely is that new asking prices step down gradually, closing the mouth from the upper jaw.The weight of this view is in what it rules out. It neither calls for a crash nor for closing prices to keep surging—it assumes a period of sideways closing prices while asks slowly converge downward.For holders, the cost in this period is liquidity, not book value; for buyers, negotiation room is opening, but the dispersion in listing quality will widen in parallel.One nuance: the seller base isn’t monolithic. Tomoko Azuma observes that must-sell clients proactively cut prices, while asset-holding sellers who are merely “happy to sell at the right price” barely move—meaning inventory will accumulate a cohort of long-stale “decorative listings” that make headline stats look worse than true conditions.Conclusion: this is a market where you need to run the numbers againOver the past decade in Tokyo’s resale condo market, picking the right area often sufficed—underwriting precision mattered less. With the crocodile mouth open, that margin for error is gone.Only two questions matter now: how far this listing’s ask is from actual closing levels in its station area, and whether its rent can support today’s mortgage rates.Neither can be answered by eyeballing. Put the listing ask, the station-area rent per tsubo, and the whole-building yield distribution into Urbalytics; the very first chart will show how wide the mouth is.#TokyoResaleCondos #WaniNoKuchi #PriceDivergence #Tokyo23Wards #MinatoWard #AzabuJuban #Iidabashi #BunkyoWard #MortgageRates #GrossYield #RenovationCosts #ResaleCondo #JapanRealEstate #CrossBorderInvestment #UrbalyticsReferences1. TV Asahi (ANN) / Yahoo! News, 2026, Condo price “crocodile mouth” phenomenon: deals fail, inventory surges; both sellers and buyers under pressure, https://news.yahoo.co.jp/articles/1786f551f56c2e3cac3ae6fe9e60dd7afc6eb9da2. Money Post Web / Yahoo! News, 2026, [Even in Bunkyo Ward: “Resale condos aren’t getting buyers!”] Expert analyzes why Minato Ward has many “risky stations”, https://news.yahoo.co.jp/articles/89da7113e71a89eabba21b7a82b46f58215bb0703. Tokyo Kantei, 2026, Resale Condominium Price Divergence Report (2H 2025, published July 30, 2026) — cited in the articles above4. Jiji Press, 2026, The benefits of AI are spreading widely; sentiment improves even among SMEs. Higher crude prices cloud the outlook — BOJ Tankan [In-depth], https://news.yahoo.co.jp/articles/c3f3603eccd1322f8088e137cfd7caaf0f991e875. Kenbiya, 2026, Will the pace of borrowing-rate hikes accelerate? The BOJ may shift from raising every six months to every three months, https://www.kenbiya.com/ar/6. Urbalytics, 2026, Azabu-Juban / Iidabashi / Tamachi station areas: whole-building yield statistics and rent statistics (platform data, retrieved October 3, 2026), https://www.urbalytics.jp/market7. Merkmal / Yahoo! News, 2026, Why did “stations in southeastern Saitama” jump by 12 ranks? The reality of Tobu Railway lines, praised for through-service to the city center and child-rearing environments, https://news.yahoo.co.jp/articles/b57579e80622428ab58ee401ca397709a910c5ef
Tokyo Metropolitan Government finally takes a stance on “flipping”: After Harumi Flag, how much of the short-term resale window remains

Tokyo Metropolitan Government finally takes a stance on “flipping”: After Harumi Flag, how much of the short-term resale window remains

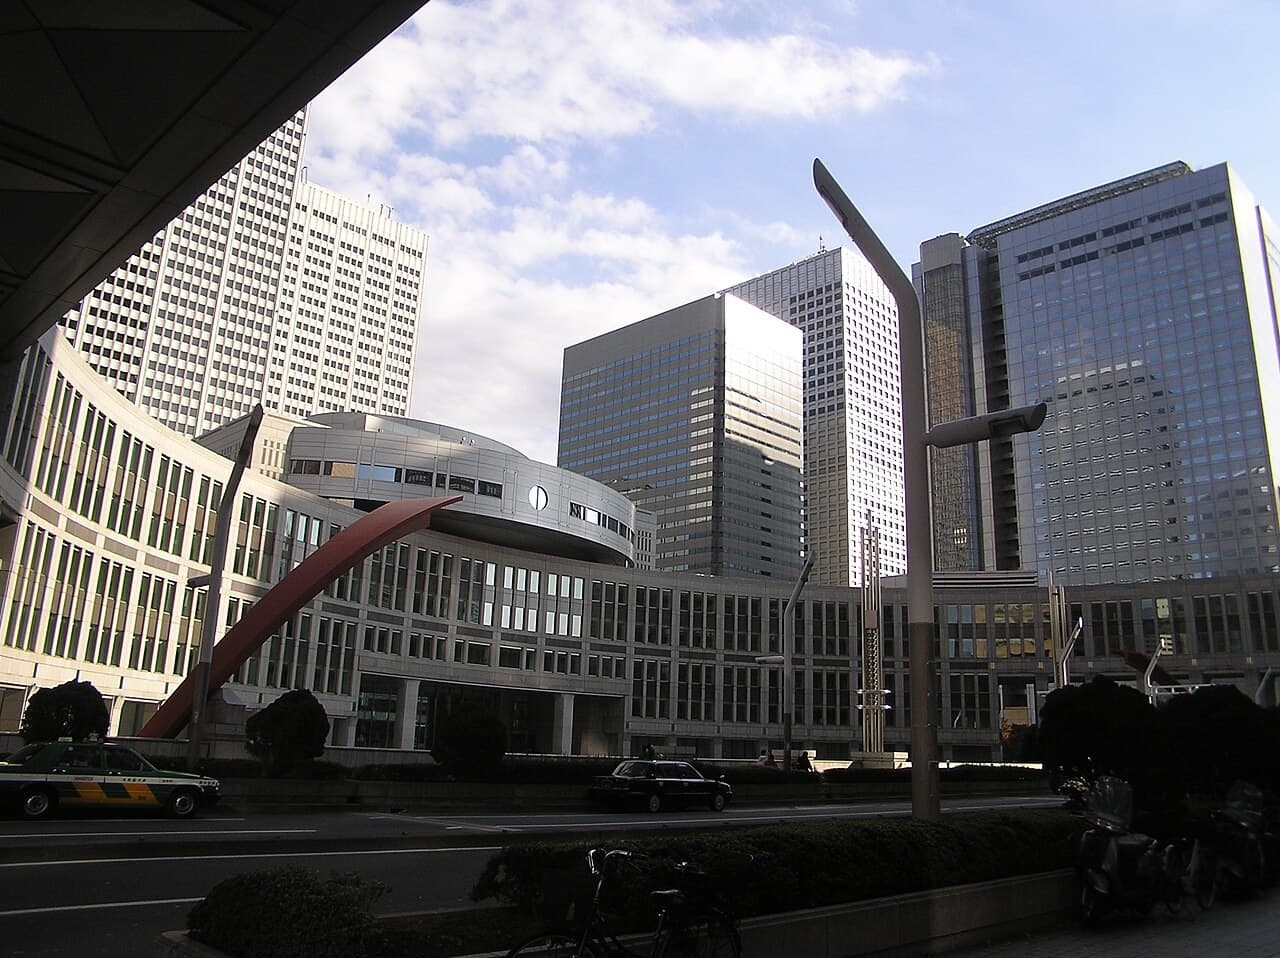
Tokyo Metropolitan Government has written curbs on speculation into its Housing Master Plan, but the market cooled first: at Harumi Flag, 65% of active listings have been reduced from their initial asking prices.At the plenary session of the Tokyo Metropolitan Assembly on September 29, 2026, Governor Yuriko Koike finally said what many had waited years to hear: the new Housing Master Plan (住宅マスタープラン) will include “effective policies” to curb speculative transactions not intended for owner-occupation.After the news broke, the most common reaction on social media was not applause but “This should have been done back at Harumi Flag (晴海フラッグ).” Behind that complaint lies a question investors should take seriously: even before rules are in place, the market is already changing.We reviewed the original planning concept released by TMG on September 11 and pulled the latest six months of resale and rental data for Harumi Flag from the Urbalytics platform. The conclusion may run counter to the instinct of “new rules are coming, sell fast.”I. Why nowTMG’s own materials spell out the backdrop. Citing data from the Real Estate Economic Institute, the average price of new-build condominiums (新築マンション) in the 23 wards rose from ¥111.81 million in 2024 to ¥136.13 million in 2025—an increase of roughly 20%—with the Tokyo-wide average reaching ¥118.55 million.In the same document, under policy challenges, it states that beyond construction costs and fewer new deliveries, “short-term resales and other speculative transactions are cited as one cause” of rising prices. This is the first time TMG has directly linked speculation to prices in an official housing policy document.National-level data had already offered corroboration. An MLIT survey published in November 2025 based on property registry information showed that among new condos over 40 square meters in Tokyo’s 23 wards during the first half of 2024, the share resold within one year was 9.9% in large-scale buildings (single-building preservation registrations of 100 units or more), versus just 3.3% in other buildings.In other words, short-term resales did not occur evenly across all new supply; they clustered in mega-projects, high-rises, and headline-grabbing developments. Harumi Flag is a textbook example.Some ward governments moved earlier. In July 2025, Chiyoda Ward asked real estate associations to add contract clauses for redevelopment projects that received subsidies or relaxations on floor-area ratio and height, generally banning resales within five years after handover and restricting multiple purchases under the same name.The Tokyo Metropolitan Assembly building in Shinjuku, where the September 29 statement was deliveredII. What exactly did Tokyo say this time?First, temper expectations: the Governor’s statement specified neither concrete measures nor an implementation timeline. Based on what is public, TMG is considering two avenues.One is to devise ways to restrict purchases made for speculative purposes in redevelopment and other projects in which TMG participates; the other is to request tax measures from the national government. The former is within TMG’s remit; the latter depends on the Diet and the Ministry of Finance, and the pace is not in Tokyo’s hands.The original text of the “Concept for Formulating the New Tokyo Housing Master Plan (都の考え方)” released on September 11 puts it this way: housing is the foundation of residents’ lives; speculative transactions not based on actual need are undesirable; TMG will study curbs while monitoring price trends.On timing, the Tokyo Housing Policy Council is expected to submit its response around December, and TMG plans to finalize the new plan within this fiscal year (i.e., by March 2027). The current plan covers FY2021–FY2030, so this is an early revision.Notably, the same document’s main axis is “making better use of existing stock”: roughly 900,000 vacant homes, roughly 1 million “pre-vacant” homes, and about 510,000 public housing units are all cited as levers to broaden housing choices. Curtailing speculation is one strand, not the centerpiece.III. Harumi Flag: a belated mirrorHarumi Flag is repeatedly referenced because TMG itself was involved. The former Tokyo Olympic Village site was sold by TMG to developers at a relatively low price and, under the “Designated Builder System” (特定建築者制度), the private sector handled construction and sales.According to reporting compiled by Shueisha Online, the lottery round in early 2023 saw an average ratio of 71.1x and a maximum of 266x, while later tower buildings reached as high as 640x. In May 2024, NHK examined registrations for six buildings totaling 1,089 units; excluding 10 unregistered units, 292 were under corporate names—about 27%—with a single corporation holding as many as 38 units.TMG’s explanation at the time was: the project is about a 20-minute walk from the nearest station; there was a long wait from contract to move-in; initial applications were even below supply; and under the Designated Builder System, TMG could not intervene in the sales method. But when NHK checked with MLIT, it was told there is no rule prohibiting TMG from involvement in sales.In fact, TMG does have precedent. “City Tower Shinagawa (シティタワー品川),” sold in 2008 as a fixed-term land leasehold condo with TMG as landowner, limited buyers to owner-occupiers, barred sales to corporations, and included a buyback clause during the first five years.Viewed together, the difference was not legal feasibility, but whether “who gets to live there” was set as a policy objective. That is the fundamental reason this latest stance drew criticism as “too late.”The slab-block residential clusters at Harumi Flag during constructionIV. Urbalytics data: Harumi Flag’s resale market is already coolingWhile policy is still on the way, the market has already responded. Using the Urbalytics platform, we extracted Harumi Flag listings with recorded price changes between April and September 2026; after deduplication there were 46 units (the system’s single-pull cap is 50 records, so the sample skews toward recently active listings).The median asking price across these 46 listings was about ¥154 million, with a median unit price of ¥6.66 million per tsubo—equivalent to roughly ¥2.01 million per square meter. As a reference point, the Urbalytics market report shows that in August 2026, the median unit price across all second-hand condos in Chuo Ward was ¥2.031 million per square meter.More important is the price trajectory. Of the 46, 30 had reduced their initial asking prices, accounting for 65%; among discounted listings, the median cut was 11.7%, with the largest around one quarter. Final transaction prices typically sit below asks, so these figures mainly show seller expectations easing.Distribution of price-cut magnitudes for Harumi Flag resales, and unit rents for 50 sqm+ rentals around nearby stationsNow rents. Over the same period there were 44 rental listings at Harumi Flag, with a median monthly rent of about ¥385,000 and a median rent of ¥4,904 per square meter. On asking prices, the gross yield (表面利回り) is only around 2.9%, before management fees, repair reserves, and taxes.Compared with 50 sqm-plus rentals around nearby stations, Tsukishima averages ¥6,015 (n=274), Kachidoki ¥5,031 (n=328), and Toyosu ¥4,399 (n=216). Harumi Flag’s rent per square meter is below Kachidoki and Tsukishima, consistent with its greater distance from stations.Urbalytics Insight Harumi Flag’s resale unit prices have caught up with the Chuo Ward median, yet its rent per square meter is below Kachidoki; a gross yield of about 2.9% indicates prices are supported mainly by scarcity and appreciation expectations, not by rental income.Chuo Ward overall shows similar signs. The Urbalytics Chuo Ward second-hand condo market report shows that in August 2026, 528 listings in the ward reduced their asking prices, with a median cut of 4.0%. The reductions are modest, but the volume of price cuts suggests sellers are no longer uniformly holding out.You can view the detailed numbers in the Chuo Ward second-hand condo market report and the Koto Ward second-hand condo market report.V. Who will be affected, and who needn’t panicBased on current information, even if TMG acts, the most likely initial target will be new-builds in which TMG participates, likely following Chiyoda Ward’s format: a no-resale period after handover and limits on multiple applications under the same name. The impact differs by investor type:First, short-term flippers whose model is “win the lottery, sell at handover” will be hit hardest. Supply of TMG-participating projects is limited to begin with; once resale-prohibition clauses are added, such opportunities will largely disappear. Layer on a cooling market, and the room to profit from spreads has already narrowed markedly.Second, investors applying in bulk under corporate names will face both “same-name purchase limits” and potential tax changes. The tax side requires national legislation, so it’s unlikely to land quickly, but the direction is clear: policy risk is rising for bulk corporate holdings of new condos.Third, buyers intending to owner-occupy or to rent long-term face little direct constraint. A no-resale clause over the first five years has almost no impact on those holding more than five years; what really needs clear arithmetic is whether rent can cover carrying costs.Fourth, the secondary market and ordinary private-sector new-builds not involving TMG are, in the near term, outside the regulatory scope. But if rules tighten and speculative capital exits, resale liquidity in popular mega-projects could be the first to feel the impact.Risk warning Specifics and timing of any new rules remain uncertain; any attempt to “front-run before the rules” rests on guesswork. Based on asking prices, Harumi Flag’s gross yield is under 3%; if floating rates continue to rise, carrying costs could consume rental income.TMG materials show that as of January 2026, representative floating mortgage rates at major banks were 0.67%, while the all-fixed Flat 35 stood at 2.08%, both on an upward path. For high-priced condos supported by low-cost leverage, interest rates will alter pro forma returns earlier and more directly than regulation.A view of the Kachidoki tower cluster from Hamarikyu GardensConclusion: Regulation lags, markets leadPut on a timeline: Chiyoda Ward moved first in summer 2025; in the fall, MLIT used registry data to confirm that short-term resales cluster in mega-projects; in September 2026, TMG wrote “curbing speculation” into its planning concept. Rules are climbing the ladder layer by layer, but each step is half a beat behind the market.For investors, the more practical takeaway is that the “lottery equals profit” era for central Tokyo new-builds has likely ended before rules take effect. From here, winners will be those who price rents, rates, and hold periods correctly—not those who move fastest.In our previous analysis, we discussed how the LDP’s land proposal would shift foreign land acquisition from “post-reporting” to “prior approval”; TMG’s latest stance is aligned with this national tightening.At the same time, rents for single-occupancy apartments in Tokyo’s 23 wards hit record highs, indicating that end-user demand has not disappeared; it is shifting from “buy to flip” back to “rent to live.”If you want to compare asking levels, price-cut trajectories, and nearby rents building by building, Urbalytics’ condo and station-area datasets can help you gauge how much of a unit’s price is supported by rental cash flow.#TokyoRealEstate #HarumiFlag #晴海フラッグ #FlippingCurbs #ShortTermResale #TokyoHousingMasterPlan #YurikoKoike #ChuoWard #Kachidoki #JapanNewBuilds #JapanRealEstateInvestment #Yield #BuyingPropertyInJapan #UrbalyticsReferences集英社オンライン(Yahoo!ニュース配信)「『晴海フラッグの時にやれよ!』小池知事がマンション投機抑制を表明も非難殺到…」, 2026, https://news.yahoo.co.jp/articles/03c8f9a31dc8eaa4e6bbaaf9144cb4fe02901d15東京都住宅政策本部「新たな『東京都住宅マスタープラン』の策定に向けた都の考え方を取りまとめました」, 2026, https://www.metro.tokyo.lg.jp/information/press/2026/09/2026091113東京都住宅政策本部「新たな『東京都住宅マスタープラン』策定に向けた都の考え方(本編)」, 2026, https://www.juutakuseisaku.metro.tokyo.lg.jp/documents/d/juutakuseisaku/juumasusakuteikangaekata_20260911東京都「令和8年第三回都議会定例会 知事所信表明」, 2026, https://www.metro.tokyo.lg.jp/governor/shisehoshin/08_03国土交通省「不動産登記情報を活用した新築マンションの取引の調査結果を公表」, 2025, https://www.mlit.go.jp/report/press/tochi_fudousan_kensetsugyo05_hh_000001_00237.html日本経済新聞「東京都千代田区マンション転売規制、投機けん制」, 2025, https://www.nikkei.com/article/DGXZQOCC270860X20C25A7000000/日経クロステック「原則5年のマンション転売禁止を要請、千代田区」, 2025, https://xtech.nikkei.com/atcl/nxt/column/18/00154/02516/Urbalytics マーケットレポート 中央区 区分マンション, 2026, https://www.urbalytics.jp/market/area/tokyo/chuo-ku/mansionUrbalytics マーケットレポート 江東区 区分マンション, 2026, https://www.urbalytics.jp/market/area/tokyo/koto-ku/mansion
From 80% to 75%: The first real easing of redevelopment thresholds for Tokyo’s aging sectional‑title condominiums

From 80% to 75%: The first real easing of redevelopment thresholds for Tokyo’s aging sectional‑title condominiums

The amended Unit Ownership Act shifts the voting denominator from all owners to those present, giving Tokyo’s cohort of sectional‑title condominiums over 40 years old a realistic path to renewal for the first time.Over the past two decades, the hardest part of dealing with Japan’s aging condos hasn’t been funding repairs—it’s been making decisions. In a 40‑year‑old sectional‑ownership building, several owners are often unreachable, some have passed away, and a notable share are investors who vanish after purchase.Under the old law, all of them were counted in the denominator for approval rates; absence effectively meant a “no” vote. The buildings most in need of major decisions were precisely those least able to assemble decision‑makers.The amendment to the Unit Ownership Act effective April 1, 2026 targets this deadlock. For offshore investors holding Tokyo condos, the change isn’t about tax rates—it’s about exit pathways.I. Why now: the time pressure of 1.48 million unitsNakano Station platform, TokyoMLIT’s estimates highlight a number that’s hard to ignore: sectional‑sale condominiums 40+ years old totaled about 1.48 million units by end‑2024, roughly 20% of the national stock of 7.131 million units.The slope matters even more. The same projection shows this rising to about 2.93 million units in ten years and about 4.83 million in twenty—nearly 3.3 times today. Each decade adds another cohort of aging condos the size of today’s.The other half of the aging story is human. As residents grow older, attendance at owners’ association (management association) general meetings falls. Health issues, relocation, loss of contact, and unprocessed inheritance all reduce the number of people who can actually express an opinion.MOJ’s legislative notes call this the “two agings”—rising building age and aging owners. Delay becomes the default, and its erosion of asset value is compounding.II. What changed: three relaxations, one that matters mostThe legal timeline is short. The Amending Act (Act No. 47 of 2025) was enacted on May 23, 2025 and promulgated on May 30, with the Unit Ownership Act and Disaster‑Area Unit Ownership Act parts effective April 1, 2026.The first relaxation concerns changes to common areas. Previously, the denominator for approval rates was all unit owners; post‑amendment it is attendees at the general meeting. As long as the quorum—more than half by headcount and more than half by voting rights—is met, repair and improvement items can’t be blocked by silent non‑attendees.This quorum is the critical precondition. If the general meeting can’t muster both majorities, changing the denominator to attendees is moot. In other words, the amendment lowers the bar from mobilizing “everyone” to mobilizing half.The second relaxation concerns redevelopment resolutions. When a building is certified as lacking seismic resistance, having inadequate fire safety, posing danger to the surroundings, being unsanitary, or noncompliant with accessibility standards, the redevelopment approval threshold drops from four‑fifths to three‑quarters.The third relaxation addresses “owners who can’t be found.” Unit owners of unknown identity or whereabouts can, once recognized by a court, be excluded from the denominator for approval calculations.The legislative notes specifically name three categories eligible for exclusion:First, owners who bought purely for investment, show no interest in management, and neither attend nor respond for extended periods.Second, former occupants long since moved away, whose registered address no longer matches their actual residence, making notices undeliverable.Third, deceased owners whose inheritance registration remains unfinished, leaving legal title unconfirmed.III. In historical context: the fourth structural patchNeighborhoods around NakanoViewed on a vertical axis, the weight of this reform is clearer. The core Unit Ownership Act dates to 1962 (Act No. 69 of 1962), when condo sales were just beginning. The law assumed new buildings and did not grapple with end‑of‑life issues sixty years on.Subsequent revisions largely followed the same path: solve “how to govern” first, then “how to repair.” This time, lawmakers wrote “how to exit” into the core for the first time, connecting redevelopment, bulk sale, and day‑to‑day management within the same statute.The form of the reform is also notable. It was not a single‑act tweak; it bundled amendments to the Disaster‑Area Unit Ownership Act, the Act on the Promotion of Proper Condominium Management, and the Act on the Facilitation of Condominium Reconstruction, among others.Such omnibus reform is uncommon in Japan’s real estate law—signaling lawmakers view the problem as too advanced for piecemeal fixes.Comparatively, Japan isn’t alone in lowering thresholds. Singapore’s en bloc system currently requires 80% owner consent for projects over ten years old and 90% for those ten years or younger; proposed reforms would lower the bar to 70% for 40+ years and 65% for 60+ years.Both markets point the same way: the older the building, the more society accepts a lower consent bar in exchange for renewal speed. Japan’s 75% threshold in specified cases sits between Singapore’s current and proposed levels, but Japan adds objective certification tests like seismic deficiency, which makes it less flexible in practice.IV. What it means for investors: a set of real numbers around Tokyo’s Nakano StationPrice and yield distribution for single‑building income properties around Nakano StationAbstract clauses only matter once they hit pricing. In the Nakano Station area, Urbalytics data show median gross yield around 4.63%, average about 4.91%, across 122 samples, with an average price near JPY 258 million.The tails tell the story. The top tier reaches 15.67%—mostly 1965–1971 vintage—while the bottom tier is just 0.65%. Within the same station area, building age creates more than a threefold spread in yields.Concretely, samples include a 1965 building in Kamitakada 2‑chome listed at JPY 29.8 million with a gross yield of about 9.90%; and a 1968 building in Nakano 3‑chome, 345 sqm, listed at JPY 140 million with a yield of about 7.10%.These high yields essentially price in that the structure is near end‑of‑life and most value resides in the land. Easing redevelopment thresholds changes precisely when and how that land can be re‑deployed.Pricing is moving too. The area’s average price per tsubo fell from JPY 4.67 million in Q4 2025 to JPY 3.87 million in Q2 2026, then rebounded to JPY 4.16 million in Q3—still down about 10.9% cumulatively.Urbalytics Insight Overlaying station‑area yield distributions and quarterly price‑per‑tsubo trends by age shows that the shift from four‑fifths to three‑quarters has not repriced all old stock—only cases that both meet seismic‑deficiency certification and carry relatively large land shares. What investors need is to place legal criteria and market data side‑by‑side in the same model.The implications differ by investor type:First, for individual investors holding single condo units, the most direct change is a higher risk of being passively pushed out—previously, non‑response could stall redevelopment; now absence forfeits your voice.Second, for corporates and institutions, the opportunity is on the buy side: 40+‑year assets with questionable seismic performance but solid land shares now allow the redevelopment option to be priced rationally.Third, for short‑term resale operators, the change is minimal—even with faster decisions, moving from proposal to ground‑breaking still takes years, ill‑suited to 1–2 year capital cycles.Risk note Lowering the threshold does not make redevelopment easy. The 75% requirement applies only when the building is certified under specified conditions like seismic deficiency; ordinary old buildings still face the four‑fifths rule. After approval, how under‑capitalized owners exit and how compensation is calculated remain practical choke points. Long‑absent foreign owners who fail to respond or attend may lose bargaining position in practice even without a court finding of “unknown whereabouts.”V. What comes nextStreetscapes around NakanoIt’s reasonable to expect no immediate redevelopment wave in the first two to three years after implementation. MOJ and MLIT ran dense briefings across all 47 prefectures in late 2025, indicating that practical absorption is just starting.A more realistic path is layered: repair and improvement items accelerate first; next, a set of best‑prepared cases run the full process; eventually, replicable templates emerge. The true inflection likely appears around 2028.For offshore owners, the task now isn’t guessing policy’s next move but completing your asset’s basic facts: is the registered address deliverable; are your management association contact details current; where do the building’s age and seismic assessment stand.Two more items merit early action: first, confirm whether a seismic diagnosis has been completed and its result—this directly determines eligibility for the 75% threshold; second, understand the association’s general‑meeting attendance over the past three years and the balance of the long‑term repair fund.What used to be administrative detail now directly determines whether you still count as a vote. To see where a building sits within its station area—yield percentile, price‑per‑tsubo trend, nearby comps—Urbalytics’ station‑area data lets you run this comparison in a single view.#UnitOwnershipAct #JapanRealEstate #TokyoCondos #AgingCondoRedevelopment #Reconstruction #CondoManagement #NakanoWard #SingleBuildingIncomeProperty #GrossYield #JapanPropertyInvestment #MinistryOfJustice #MinistryOfLandInfrastructureTransportAndTourism #CrossBorderInvestment #Tokyo23Wards #UrbalyticsReferences1. @DIME (Yahoo! News), 2026, “What is the impact on condominium management of the Unit Ownership Act amendment that took effect in April?”, https://news.yahoo.co.jp/articles/ea012e7e1ab0d29a6f45530cd7488b7f0ec550ac2. Civil Affairs Bureau, Ministry of Justice, 2026, “On the Act to Partially Amend the Act on Building Unit Ownership, etc., to Facilitate the Management and Regeneration of Aging Condominiums, etc.” (Act No. 47 of 2025), https://www.moj.go.jp/MINJI/minji07_00375.html3. Ministry of Land, Infrastructure, Transport and Tourism, 2026, “Statistics and data on condominiums (number of sectional‑sale condominiums 40+ years old)”, https://www.mlit.go.jp/jutakukentiku/house/jutakukentiku_house_tk5_000058.html4. The Straits Times / Channel NewsAsia, 2026, “Lower en bloc thresholds to address costs of maintaining old properties”, https://www.straitstimes.com/singapore/politics/lower-en-bloc-thresholds-address-costs-of-maintaining-old-properties-facilitate-renewal-edwin-tong5. Urbalytics platform data (Nakano Station area single‑building yield and price‑per‑tsubo statistics, retrieved September 2026), https://www.urbalytics.jp/market
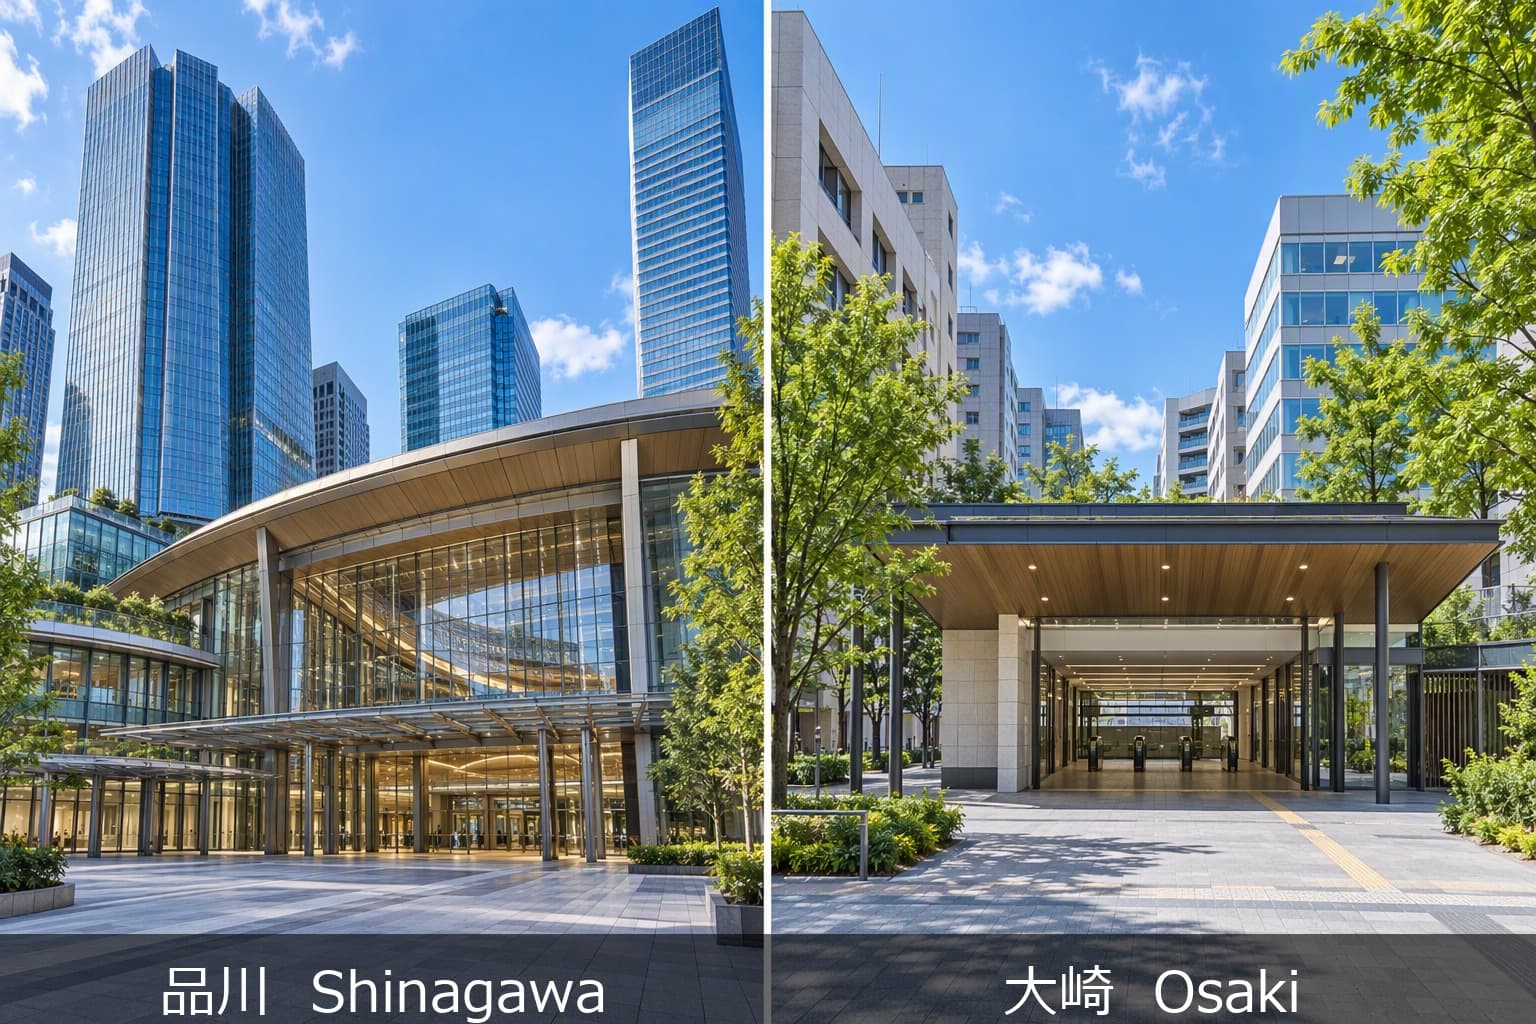
One Stop, 2.3x Price Gap: Shinagawa vs Osaki Yield Cliff

One Stop, 2.3x Price Gap: Shinagawa vs Osaki Yield Cliff

Shinagawa is Tokyo's southern gateway. Shinkansen, Keikyu Line, and Yamanote Line all converge here, funneling hundreds of thousands of commuters every day. The maglev Chuo Shinkansen is planned to terminate here, and redevelopment crews are tearing down old blocks around the station one by one. For many investors, Shinagawa equals "the next place in Tokyo that will go up."Osaki is the next stop south on the Yamanote Line, two minutes from Shinagawa. Many people have only a vague impression of it: they know it's near Shinagawa, but can't name what's there. The think park office complex sits in front of the station, and Sega Sammy Holdings has its headquarters nearby, but Osaki rarely makes headlines. It sits quietly in Shinagawa's shadow, like a forgotten neighbor.But open the urbalytics income property data, and the picture between these two stations suddenly gets interesting. The average price of income buildings listed at Shinagawa is about 506 million yen. At Osaki, it's about 216 million. One stop apart, a 2.3x price gap. The yield gap is even wider: Shinagawa averages 2.58%, Osaki 4.81%, nearly double.The 2.3x Price Gap and Near-Double Yield DifferenceHere is the core data comparison:Across four dimensions, Shinagawa is consistently "more expensive, lower yield." But on one metric, Osaki actually wins: average walking distance to the station. Properties listed at Shinagawa average 10.5 minutes on foot; at Osaki, just 8.9 minutes. In other words, Osaki's buildings are closer to the station but cost less than half as much.The yield spread is equally striking. Among Shinagawa properties with income data, the best yield is 3.40%, the worst 1.46%. At Osaki, the range runs from 7.57% down to 2.80%. Shinagawa's best result doesn't even match Osaki's average.Price Distribution: Shinagawa in the Mid-to-High Range, Osaki Under 100 MillionBreak down the listings by price band and the contrast sharpens:Of Shinagawa's 15 listed buildings, only one sits below 100 million yen. Most cluster in the 100-to-500 million range, with two exceeding 1 billion. At Osaki, 13 of 45 listings fall under 100 million, and 22 sit in the 100-to-300 million band. The core price tiers of these two markets don't overlap.Supply itself tells a story. Shinagawa has 15 listings; Osaki has 45, three times as many. Scarcity pushes Shinagawa's prices up, but it also means investors there have a very narrow field to choose from.Rents Are Almost the SameIf prices differ by 2.3x, are rents also 2.3x higher at Shinagawa? The answer is no.According to urbalytics rent data, the average unit rent for apartments near Shinagawa Station is about 5,534 yen per square meter per month. At Osaki, it's about 5,384 yen. The gap is just 3%.This is what makes the comparison fascinating. Rental demand intensity at the two stations is nearly identical, yet sale prices differ by 2.3x. The price gap doesn't come from the rental market. It comes from capital value premium. Put differently, buyers at Shinagawa aren't paying for higher rental returns. They're paying for the story of future appreciation.Where Shinagawa's Premium Comes FromShinagawa Station is undergoing one of Tokyo's largest redevelopment projects. The Yamanote Line's new station Takanawa Gateway opened in 2020 right next door. The maglev Chuo Shinkansen is planned to terminate here, with direct service to Nagoya expected in the 2030s. Old blocks around the station are being replaced with large office buildings and commercial complexes.These narratives have pushed up land value expectations. Investors accept 2.58% yields because they're betting on capital appreciation. But there's a catch worth flagging: only 4 properties at Shinagawa have income data, a small sample. The average price is pulled up to about 1.1 billion yen by high-priced outliers. This "average" has limited representativeness.Osaki's Quiet ValueOsaki is changing too. The think park complex in front of the station houses major offices, and Sega Sammy Holdings has its headquarters nearby. New office projects have been completed, and some listings sit just 3 minutes from the station. But Osaki lacks a "maglev terminal" caliber story, and media coverage is far thinner.On paper, Osaki's value proposition is "same rent level, half the entry price." The 4.81% average yield is high for the Yamanote Line. And 45 listings give investors far more room to choose, ranging from a compact 40.15 million yen building up to 1 billion yen properties.But Osaki carries risks too. Market data shows significant tsubo-price volatility, with notable swings between October 2025 and August 2026. The sample is larger than Shinagawa's (24 properties with income data), but liquidity remains limited.What Investors Should Look AtThe Shinagawa versus Osaki comparison boils down to a choice between buying a story or buying numbers.Choosing Shinagawa means accepting minimal cash flow returns and betting on land appreciation driven by redevelopment. This path suits investors with ample capital, long holding periods, and deep research into area development plans. Keep in mind: few listings, high prices, low yields, and substantial barriers to entry.Choosing Osaki means getting nearly double the yield at half the price while tapping into rental demand comparable to Shinagawa's. Shorter walking distances, more supply, but no powerful appreciation narrative. This path suits investors who prioritize cash flow and higher immediate returns.Either way, use the property search tool to compare actual listings. Averages sketch the trend, but every investment comes down to evaluating a specific building.For deeper data on these stations, check the Shinagawa station market page and Osaki station market page for granular price trends and listing details.
LDP Proposes Foreign Land Permits: Tokyo Market Impact

LDP Proposes Foreign Land Permits: Tokyo Market Impact

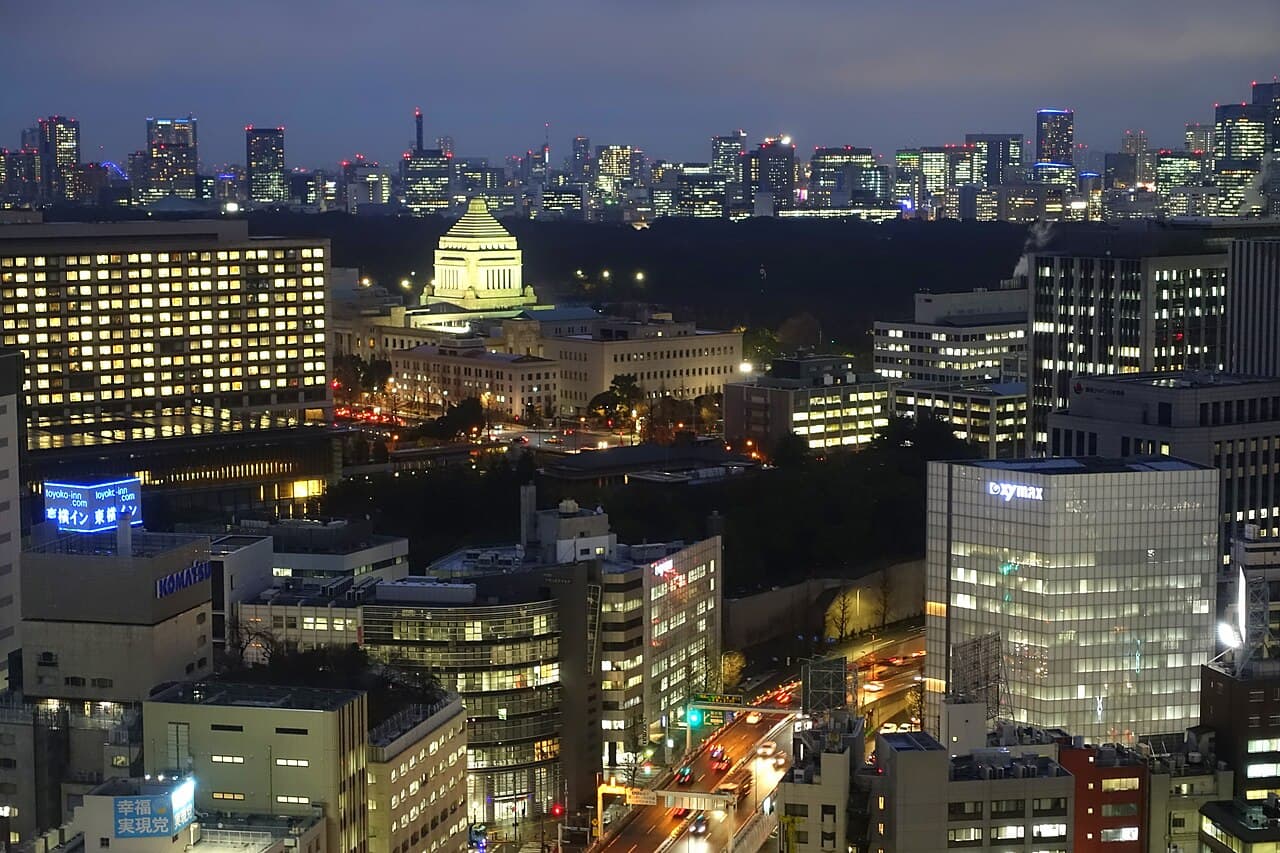
LDP Proposes Permit System: From Declaration to Approval On September 24, 2026, the LDP's Foreign Nationals Policy Headquarters submitted a proposal to the Japanese government, seeking to revise the Act on Investigation of Important Land during the extraordinary Diet session opening October 5. The core change upgrades the current "post-acquisition reporting" system to a "pre-acquisition permit" system. Under the proposal, land ownership transfers within 1km of Self-Defense Force facilities would require government screening. New areas added to the regulated zone include the Imperial Palace, the National Diet Building, the Prime Minister's Official Residence, and uninhabited border islands. Applications from foreign governments, foreign military personnel, and their affiliates would be denied in principle. Transactions without permits would be invalidated, with penalties added. The proposal also addresses urban apartment price increases, noting that speculative purchases by foreign capital have caused public concern, and suggests considering tax measures or time-limited restrictions to curb speculation. The Scale of Foreign Capital: A 1 Trillion Yen Market Foreign investment in Japanese real estate continues to grow. According to Mitsubishi UFJ Trust Bank, 20% to 40% of new condominiums in Tokyo are sold to foreign nationals. In the first half of 2025, overseas investors purchased over 1 trillion yen worth of Japanese real estate, a record high. Foreign investors now account for 27% of total real estate transactions in Japan, up from 21% five years ago. Shinjuku skyline. Tokyo's central five wards account for 42% of all foreign investment in Japanese real estate. CBRE reports that Tokyo has ranked first globally in cross-border real estate investment for seven consecutive years. Factors attracting foreign capital include the depreciated yen creating a price discount, relatively low interest rates, minimal restrictions on foreign property purchases, and Japan's political stability within Asia. By region, Tokyo's central five wards (Chiyoda, Chuo, Minato, Shibuya, Shinjuku) account for 42% of all foreign investment. Osaka, Niseko, Kyoto, and Fukuoka also attract varying levels of capital. Investors originate primarily from the Greater China region, with increasing participation from the United States, South Korea, and the Middle East. Tokyo's Central Five Wards: Market Reality What does the market look like in the areas where foreign capital concentrates? Using urbalytics property search and building cap rate stats, we can observe sale price levels in core areas. Shibuya Station currently has 56 commercial buildings listed for sale, with an average asking price of approximately 840 million yen and an average surface cap rate of 4.01%. Over the past 12 months (September 2025 to September 2026), the average price per tsubo rose by 8.25%. Shinjuku Station has 31 listed buildings with an average price of approximately 730 million yen, up 6.38% over the same period. Tokyo Station has extremely limited building listings, with an average price of 560 million yen. Average sale price per tsubo trend for commercial buildings near Shibuya, Shinjuku, and Tokyo stations. Data source: urbalytics building_cap_rate_stats. For land listings, Shibuya Station has 57 parcels averaging 14.47 million yen per tsubo; Shinjuku has 17 parcels at 13.91 million yen; Tokyo has limited land parcels at 10.75 million yen. Overall, cap rates in central Tokyo are compressed to the 3% to 4% range, with foreign capital competition driving up asset prices. urbalytics Data Insight: Shibuya's 56 buildings and 57 land parcels for sale form the largest investment-grade market in central Tokyo. The 8.25% price increase over 12 months indicates strong foreign demand, but a 4% cap rate means asset prices are already elevated. If the permit system extends to general real estate transactions, market liquidity could be affected. For now, this risk has not materialized. Market Impact: Three Dimensions First: Limited direct impact. The permit system targets land within 1km of SDF facilities and specific sensitive areas. Most residential and commercial properties in Tokyo's central five wards fall outside this scope. Foreign individual investors purchasing standard condominiums and commercial buildings remain unaffected under the current framework. Second: Significant signaling effect. The regulatory direction has shifted from "knowing who buys" (nationality declaration, April 2026) to "controlling whether they can buy" (permit system proposal, September 2026). This policy trajectory may influence foreign investor expectations. Some investors may accelerate transactions before regulations tighten, potentially driving up short-term volume. Third: Uncertainty over follow-up measures. The proposal mentions considering tax measures or time-limited restrictions to curb speculative purchases. If measures similar to Canada's temporary ban on non-resident purchases or Australia's "new-build only" policy are introduced, the impact on Tokyo's high-end condominium market would be more direct. These measures remain at the discussion stage. What Investors Should Watch For investors focused on Japanese real estate, it is important to distinguish between two dimensions: whether actual transactions are restricted, and whether market sentiment is affected. On actual transactions, searching on urbalytics reveals that central Tokyo still has substantial supply. With 56 buildings and 57 land parcels in Shibuya, and 31 buildings and 17 land parcels in Shinjuku, the market remains well-supplied. Commercial properties, while cap rates are compressed to 3% to 4%, still see active transactions. Detailed property listings and price trends can be found on the Shibuya Station market page. On market sentiment, the extraordinary Diet session's deliberation progress is worth monitoring. If the amendment passes this year, implementation in fiscal 2027 becomes more likely. Investors can use the urbalytics data platform to track listing volumes and price changes in core areas, identifying any abnormal movements driven by policy expectations. Search Tokyo Central Properties on urbalytics Click here to use the urbalytics search feature and explore condominiums and commercial properties for sale in Tokyo's central five wards. Filter by station, price, size, and cap rate. Risk Disclosure: Sale price and cap rate data cited in this article represent listing benchmarks, not actual transaction prices. Surface cap rates do not deduct management fees, repair costs, or taxes. Regional averages may obscure individual property differences. Policy content is based on the proposal stage; actual legislation depends on Diet deliberation outcomes. This article does not constitute investment advice. #JapanRealEstate #TokyoProperty #ForeignInvestment #LandRegulation #LDP #PermitSystem #urbalytics ※ Charts in this article are generated from urbalytics platform data. The cover image shows the National Diet Building, and the Shinjuku skyline image is from Wikimedia Commons. References JPChina Press, "LDP Proposes Permit System for Foreign Land Purchases Near Sensitive Areas," September 25, 2026 Mitsubishi UFJ Trust Bank survey on foreign national purchase ratios for new Tokyo condominiums CBRE Cross-Border Real Estate Investment Survey (Tokyo ranked first for 7 consecutive years) urbalytics platform data (search_properties / building_cap_rate_stats, retrieved September 2026) Ministry of Land, Infrastructure, Transport and Tourism, "Expert Council Proposal on Land Acquisition and Use," August 2026
Land Prices Return to 2007 Levels, While Asakusa Buildings Quietly Mark Down: Three Divergences in the 2026 Benchmark Land Prices

Land Prices Return to 2007 Levels, While Asakusa Buildings Quietly Mark Down: Three Divergences in the 2026 Benchmark Land Prices

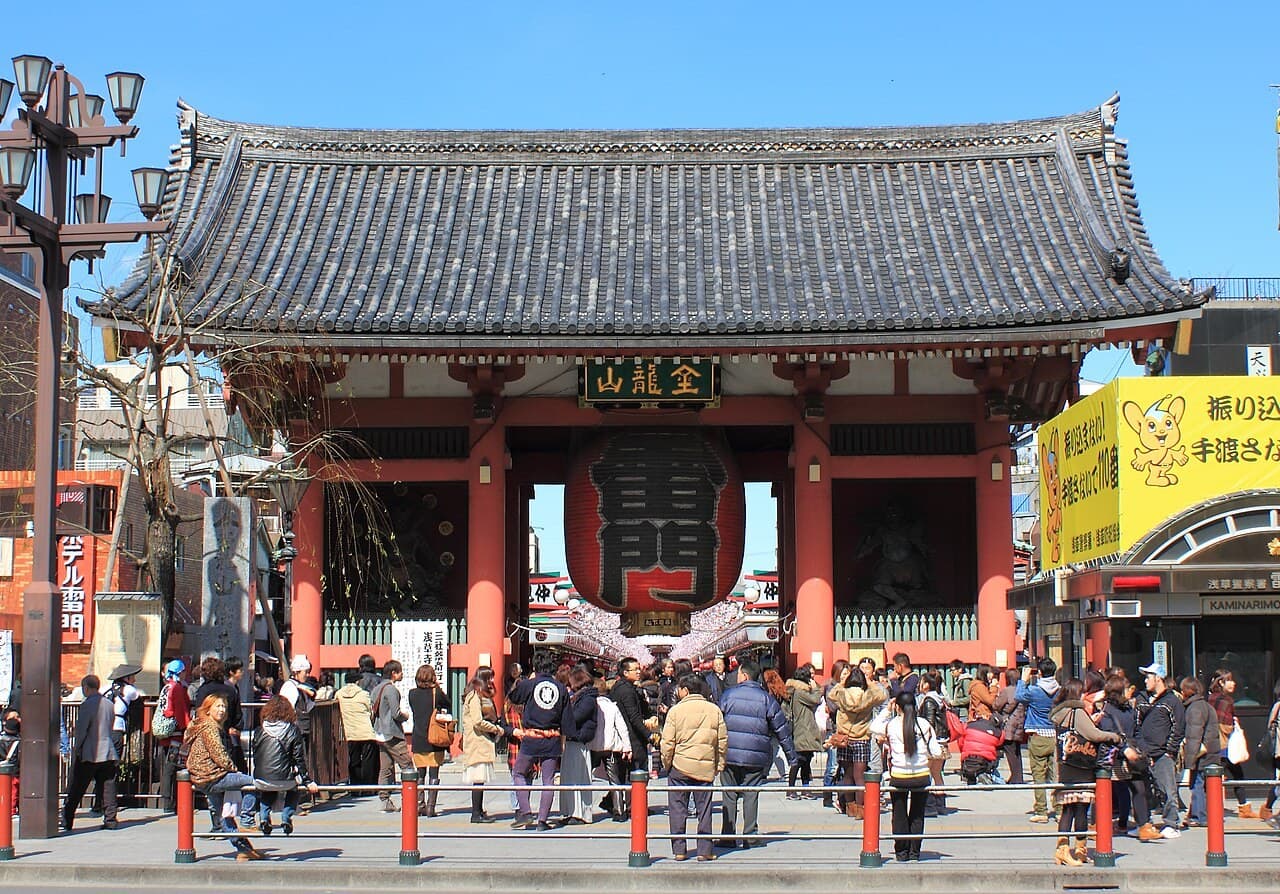
In Tokyo’s 23 wards, residential land rose by 8.7%, yet live-market data show that the price per tsubo and rents for income-producing buildings have not kept pace with that curve.On September 15, 2026, the Ministry of Land, Infrastructure, Transport and Tourism (MLIT) released the Prefectural Land Price Survey results (Kijun Chika, as of July 1) for 21,466 benchmark points nationwide. The nationwide average across all uses rose 1.5%, marking five consecutive years of gains.But what investors should really pause to examine is not that average, but the set of gaps underneath it.Residential land across Tokyo’s 23 wards rose 8.7%, the largest increase since 2007 before the Lehman shock; the prior year was 8.3%, indicating further acceleration. Tokyo Metropolis also ranked first for the first time in 12 years among prefectures in residential land price growth.Yet when we pull the same-period live listings and transaction data on the Urbalytics platform, we see a curve pointing the other way.Kaminarimon • Senso-ji (Taito Ward, Tokyo)The numbers: where the rally is, and where it’s starting to slowFirst, the public-data backbone. Nationwide, residential land rose 1.0%, flat versus the prior year; commercial land rose 2.9%, slightly above the prior year’s 2.8%. The three major metropolitan areas rose 4.4% overall; within that, the Tokyo metro rose 5.4% across all uses, with commercial land up a striking 8.9%.Within the Tokyo metro, the leader in residential land gains was Kita-Shinagawa in Shinagawa Ward, up 18.8%, followed by Shibaura in Minato Ward, up 18.7%. The common driver is large-scale redevelopment around Takanawa Gateway Station (高輪ゲートウェイ駅)—the market is buying not present convenience, but expected future convenience.The closer to the core, the steeper the rise: the Central 3 Wards’ residential land growth accelerated from 13.1% to 13.9%, the Central 6 Wards from 12.8% to 13.3%, and the 23 wards overall from 8.3% to 8.7%. MLIT’s language was cautious, noting only that it is “hard to say there is already a sense of pause” in condominium prices.That’s only half true. In the same survey, ultra-core areas like Chiyoda and Chuo actually saw narrower gains. An MLIT official put it more bluntly: with condominium prices persistently high, some demand has already been shaved off.Development works between Takanawa Gateway Station and Shinagawa (Minato Ward, Tokyo)On the commercial side, Tokyo accounts for 6 of the nationwide top 10 gainers, 4 of them in Asakusa, Taito Ward. One Asakusa commercial site rose 26.9%, another 25.0%—reports say prime Asakusa land values have climbed to 2.2 times in five years.The driver is unsurprisingly inbound tourism. But it brings more than revenue: rising land values push up rents, and coupled with succession challenges, traditional shops in Asakusa are closing one after another. Teruko Tominaga (89), who runs the handmade soba shop “Towada,” told reporters that on this street “only my place and the one across” are not chain stores anymore.Divergence 1: Land is rising while the price per tsubo of whole-building income assets is fallingHere’s the first divergence. Using Urbalytics’ station-area data for Asakusa whole-building income properties (一棟), we pulled a time series that is almost a mirror image of the land-price curve.Data source: UrbalyticsIn the Asakusa station area, there are 132 on-market whole-building samples. The average gross yield (表面利回り) is 5.64%, with a median of 4.60%, and the average asking price is about JPY 444 million. Not bad at first glance.But the trajectory of average price per tsubo is the key: 2025Q4 at JPY 4.6274 million/tsubo, down to 4.1095 million in 2026Q1, 4.0498 million in Q2, and further to 3.5660 million JPY/tsubo in Q3. Over four quarters, that’s a 7.76% decline, or roughly 1.94% per quarter on average.In other words, in the very neighborhood where published land values printed +26.9%, the unit asking prices of the income buildings actually brought to market have fallen for three consecutive quarters.The two series are not contradictory—they measure different things. The benchmark land price measures the land itself under highest-and-best-use assumptions, while price per tsubo measures the market ask for the entire asset with an aging structure, legacy leases, and legacy income. When the former is pushed up by inbound-driven commercial expectations while the latter is held back by building age and financing costs, a scissors gap emerges.Divergence 2: Rents are not paying for the landThe second divergence is on the leasing side, which is the true source of hold-period cash flow.Asakusa Station — Ginza Line station signUrbalytics’ Asakusa station-area condominium rental data show an average monthly rent of JPY 145,700 and an average area of 34.28 m², equivalent to an average rent of about 0.434 ×10,000 JPY/tsubo·month. By quarter, 2026Q2 printed 1.48 ×10,000 JPY/tsubo·month, and Q3 declined to 1.43 ×10,000, a 3.38% drop over the period.The Shinagawa station area looks slightly better but not strong: average monthly rent JPY 318,800, average rent per tsubo 0.553 ×10,000 JPY/tsubo·month; 2026Q1–Q3 came in at 1.76, 1.75, and 1.90 ×10,000 JPY/tsubo·month respectively. The latest quarter did rebound, but overall it remains a narrow range trade.Put the three lines side by side and the logic is clear: land is rising, sale prices are softening, and rents are flat to drifting lower.Urbalytics Insight For hold-to-earn investors, this mix means the numerator and denominator of the gross yield are moving in the same direction but asymmetrically—price per tsubo fell 7.8% over four quarters, while rent per tsubo fell 3.4% in the same period. The net effect is a slight, mechanical uptick in quoted yields, not one driven by operational improvement. The 4.60% median gross yield for whole-building assets in the Asakusa station area should be read against the backdrop of “assessed land values and actual transaction pricing are diverging,” rather than misread as “cheap.”Note that in the Shinagawa station area there are only 3 on-market whole-building samples (median gross yield 2.41%); the sample is too small to rely on by itself. Likewise, Asakusa’s 2025Q3 price-per-tsubo sample has only 8 observations and is marked as reference.Divergence 3: Gains are spilling over to the outer rim of the one-metropolis/three-prefectures regionThe third divergence is spatial. As core-area gains begin to narrow, demand hasn’t disappeared—it’s spilling over to the periphery.Chiba Prefecture is the clearest case. All-use average rose 3.8%, residential land 3.4%, and most of the top-10 gainers are in Nagareyama City. The top spot is “Nagareyama Higashi-Hatsuishi 3-chome 103-82,” near Hatsuishi Station on the Tobu Urban Park (Noda) Line, up 18.7% and ranking first for the second straight year.Note that the area around Nagareyama-Ōtakanomori Station has long traded at elevated levels, so demand shifted to the cheaper outer rim—Higashi-Hatsuishi is a product of that logic. The Tsukuba Express (TX) commuting access plus a family-friendly environment provide the underlying power for this diffusion chain.Kanagawa Prefecture tells a variant of the same story. Residential land rose 3.1%, commercial land 7.2%; among 663 continuously surveyed residential sites, 611 rose and only 3 fell. Kawasaki City rose 4.3%, explicitly attributed to “a sense of relative price advantage versus inner Tokyo.”Around Hashimoto Station in Sagamihara City, pricing is almost entirely expectation-based—anchored to hopes for a new station on the Maglev Chuo Shinkansen (リニア中央新幹線).Of course, spillover does not equal safety:First, the periphery’s large percentage gains partly reflect a low base rather than a structural shift in demand; if interest rates rise and compress affordability, the outer rim is often the first to stall.Second, while industrial land in Chiba rose 8.0% and has been positive for 14 straight years, the rate has been narrowing from 8.2% two years ago. Appraisers note that rising construction costs are pushing demand “out to cheaper sites”—that is cost-pushed spillover, not demand-pulled spillover.Investment takeaways: read “land price news” separately from “yield decisions”The most useful way to read this benchmark land-price release is not to confirm that “Japan real estate is still rising,” but to locate where your segment sits relative to the scissors gap.For commercial-land assets whose core logic is inbound tourism, Asakusa has already priced expectations into land values, while the actual price per tsubo for buildings is retreating—this implies more room to negotiate on entry than headlines suggest, provided you are comfortable with older structures and operating risk.For residential assets in the one-metropolis/three-prefectures region, the diffusion logic remains intact, but separate “big percentage gains” from “ample margin of safety”—areas like Higashi-Hatsuishi merit attention, while chasing already-run-up core station fronts may not.Risk warning The biggest variables remain interest rates and construction costs. In its commentary, MLIT explicitly flags “how future interest-rate trends and rising construction costs will affect land acquisition appetite” as a key focus. If financing costs continue to rise, the first to be pressured will not be assessed land values, but the price per tsubo and absorption speed of income buildings—precisely the direction already visible in the three sets of live-market data cited here.If you want to overlay land prices, price per tsubo, rents, and yields for a specific station area on a single chart, you can pull that area’s live data directly on Urbalytics by station name—and then decide whether to believe the percentage in the news headline.#TokyoBenchmarkLandPrices #BenchmarkLandPrice2026 #Tokyo23Wards #Asakusa #KitaShinagawa #Nagareyama #ChibaLandPrices #KanagawaLandPrices #WholeBuildingIncomeProperty #GrossYield #RentPerTsubo #InboundTourism #JapanRealEstateInvestment #TakanawaGateway #UrbalyticsReferences1. MLIT, Prefectural Land Price Survey 2026 (Benchmark Land Prices, as of July 1), released September 15, 20262. Asahi Shimbun, "Fixed-term lease condos gain attention in central Tokyo; tend to be 10–20% cheaper than for-sale units", 2026, https://news.yahoo.co.jp/articles/893f26a8838042dae017a2d61180a3ef0a47940b3. TBS NEWS DIG, "2026 benchmark land prices: Strong inbound demand drives sharp gains in Hakuba and Asakusa; Tokyo tops residential land growth for first time in 12 years", 2026, https://news.yahoo.co.jp/articles/8a83fd8f03a64f485dc05d47dfcd1a0bd823a83c4. TBS NEWS DIG, "2026 benchmark land prices: Asakusa surges on inbound demand, but traditional shops shutter amid soaring land costs", 2026, https://news.yahoo.co.jp/articles/222b2d2d765bae9be8c52b5fc443f7e1c393ceb45. Kenbiya, "MLIT releases benchmark land prices: Nationwide land up for 5th straight year; commercial land +2.9%, led by Tokyo and Osaka", 2026, https://www.kenbiya.com/ar/ns/research/china/10538.html6. Sankei Shimbun, "TX corridor and child-rearing environment boost demand; in Chiba Prefecture, most top residential land gainers are in Nagareyama", 2026, https://news.yahoo.co.jp/articles/0d11bd63ea03e1b163f9a595e62ecf9a4754c4277. Sankei Shimbun, "Commuting convenience and Shonan lead gains; in Kanagawa, residential land up, commercial land lifted by inbound demand", 2026, https://news.yahoo.co.jp/articles/1d8de9ef7b4c12cd37092e4dfa3e9491f20a9bad8. Reuters, "2026 nationwide benchmark land prices +1.5%, fifth straight annual gain, reflecting moderate economic recovery", 2026, https://news.yahoo.co.jp/articles/b90ac3cf6362711079fcb59a17de39486c5b2aaa9. Urbalytics platform data (Asakusa & Shinagawa station areas: rent_stats / building_cap_rate_stats), retrieved September 15, 2026, https://www.urbalytics.jp
The 'Crocodile Mouth' at 30%: In Tokyo’s Central 3 Wards, Asking Prices for Existing Condos Await an Inevitable Downward Reset

The 'Crocodile Mouth' at 30%: In Tokyo’s Central 3 Wards, Asking Prices for Existing Condos Await an Inevitable Downward Reset

A roughly 30% gap between asking and contract prices can only be closed by sellers backing down—because rents have not risen in tandem.On September 2, 2026, real estate strategist Tomohiro Makino noted in an interview that prices for existing condos in Tokyo’s Central 3 Wards (Chiyoda, Chuo, Minato) have been hitting a ceiling since late 2025. That in itself isn’t news. What should make investors pause is the number he put on it: the current gap between sellers’ asking prices and actual contract prices is roughly 30%.The industry in Japan has a vivid nickname for this gap—the “Crocodile Mouth” (ワニの口). Contract prices lie flat while asking prices keep rising, and the two lines on the chart open wider and wider. For any cross-border investor holding core assets or preparing to enter, when—and from which side—this mouth closes matters far more than “how many points up this year.”1. A 30% gap is arithmetic you can actually work outMakino offers an anchor you can sanity-check. The industry commonly believes that the main buying force—dual high-income households (“power couples,” パワーカップル)—can stretch to a total purchase price of about JPY 120–130 million within mortgage affordability. That is effectively the ceiling on contract prices.Add 30% on top of that ceiling and sellers’ asking ambitions land in the JPY 170–180 million range. The issue isn’t whether that’s expensive; it’s that it physically exceeds buyers’ borrowing capacity—it’s not unwillingness to buy; loans simply won’t be approved.Makino also highlights a detail that’s easy to miss: the recent media stories about “declines in central-city condo asking prices” refer to sellers’ aspirational prices, not contract prices. The fact that even aspirations are softening shows sellers are running out of resolve—that’s the weight of the signal.The real coordinates to watch are the “registered (listing) price” and the “contract price” lines published by the Real Estate Information Network for East Japan (REINS). When the gap is so wide that sellers must move toward buyers, the market is no longer debating “how much more upside,” but “who blinks first.”Central Tokyo streetscape2. This surge wasn’t fueled by demand; it was fueled by resellers’ balance sheetsTo understand why asking prices ran so far, look at who is quoting them. Makino points to the resale behavior of small and mid-sized real estate operators, whose economic logic is straightforward.They buy 15–20-year-old condos in the bayside area, do a light renovation, and relist roughly six months later. The shift from brokerage to principal positions occurred because pure brokerage only earns a 3% fee; in a market that at one point showed 30–40% YoY gains, buying to flip is obviously more lucrative.Principal buying became the industry habit, and the pricing framework began to follow operators’ cost bases rather than end buyers’ ability to pay. In an upswing, those two curves can move in parallel; once end-user demand falls behind, the distance between them turns into inventory.That’s exactly what is clogging the market now. Makino believes that cutting from the JPY 170 million asking level would push operators into a loss, so in recent months they have chosen to hold their ground rather than cut—this is price rigidity dictated by the balance sheet, not by demand. It delays the reset, but it also makes the eventual reset larger.High-rise residential cluster around Shibaura, Minato Ward3. The rental side gives a different answer: the true level in the Central 3To judge which side the mouth will close from, the most reliable reference is not asking prices but rents—because rents are the only variable priced by real usage demand and cannot be pushed up by resellers’ balance sheets.Urbalytics data show that in the Tamachi station area, rent for rental condos rose from JPY 17,100 per tsubo per month to JPY 17,200 per tsubo per month over the past four quarters, a cumulative change of just +0.58%, with the sample expanding from 4 to 143 cases—evidence of a solid, flat trend. Jimbōchō over the same period printed −1.42%. The Ginza station area has thin samples (6–12 per quarter; indicative only) and recorded −26.02% over two quarters.In other words, during the period when asking prices were up 30–40% YoY, residential rents in the Central 3 Wards were essentially flat, with pockets of weakness. That knocks out much of the foundation under the narrative that “prices are rising because the core is undersupplied.”Whole-building income properties (一棟収益物件) read even more directly. In the Tamachi station area, average gross yield (表面利回り) on on-market buildings is 3.68%, with a median of 3.88%, and an average asking price of JPY 730 million; in the Ginza station area, the average is 3.28% and the median just 2.68%, with an average price of JPY 1.138 billion. At a time when long-term interest rates are brushing 3%, the yield gap (イールドギャップ) has been almost compressed away.Urbalytics: Central 3 Wards rent per tsubo and whole-building yield analysisUrbalytics Insight The value of Urbalytics’ internal data lies in tracking actual listings and actual leases, rather than association-weighted indices. When asking and contract prices are at odds, lining up rent per tsubo and whole-building gross yields is the only way to bypass the seller-side narrative for cross-checking—Tamachi’s near-zero rent growth across four quarters alongside gross yields of only 3.68% together form the most direct rebuttal to “the core can climb another 30%.”4. Rates have yanked away the last cushionTime can digest price gaps—but only if funding costs stand still. As of September 2026, that premise no longer holds.Reports the same day show Japan’s long-term interest rate briefly touched 3% for the first time since 1996, against a backdrop of mounting fiscal concerns. At the retail end in September 2026, mortgage rates saw variables on hold for now, while the 10-year fixed and Flat 35 (フラット35) both rose.The damage here is less about amortization tables and more about buyer psychology. Many buyers had assumed “I’ll run a variable; interest can be ignored.” Once hikes enter daily view, the same person’s willingness to pay for the same home automatically ratchets down.Makino’s view: operators can still grit their teeth for a few months, but end-user demand is clearly lagging; the market is turning lower. When asking prices hover 30% above contracts, rents are flat, and rates are rising, the direction of travel is no mystery—only the cadence is.Tamachi Station platform5. Where the reset starts—and where it spreadsMakino is explicit that the adjustment will not stop in the Central 3 Wards, nor in the Central 6 (adding Shinjuku, Shibuya, and Bunkyō), but will diffuse outward. Two opposing forces are embedded in that diffusion path, and investors should separate them:First, some buyers squeezed out of the Central 6 will shift beyond those wards. This spillover demand will, to a degree, tighten supply-demand in surrounding areas and support peripheral prices—the recent strength in single-family (戸建て) markets in Chiba, Kanagawa, and Saitama is a direct result of households “priced out of Tokyo” buying in the suburbs.Second, if overall interest rates continue to climb, more buyers will fall below mortgage underwriting thresholds and demand itself will contract—at which point spillover may not hold the line. In other words, the periphery is receiving a relocation of demand, not an increase; these behave very differently in a rising-rate phase.For investors already holding core assets, the real risk now is not mark-to-market shrinkage but liquidity. When asking and contract prices are 30% apart, listing volume does not equal executable volume; exit cycles will lengthen materially.Risk alert Beware mistaking “declining asking prices” for “a buy-the-dip window.” What is softening now are sellers’ aspirations; contract prices have not moved down in step. This means the gap is compressing from above, not being lifted from below. With flat rents, sub-4% gross yields, and long-term rates around 3%, the window for capital-gain (キャピタルゲイン) plays has closed. Only cash flow can carry the hold period.6. Conclusion: the mouth will close from the topPut together, the Central 3’s position is clear. Asking prices are pinned high by reseller cost structures; contract prices are capped around JPY 130 million by borrowing capacity; rents have been essentially flat for four quarters; and funding costs are rising at levels not seen since 1996.Of the four variables, only the asking price can move. The “Crocodile Mouth” will most likely close from the top—i.e., through seller-led markdowns, not buyers chasing higher. For buyers, patience itself is a return; for holders, exit plans should be re-laid on a longer timeline.This market will reward those who validate prices with rents and yields, not those who keep reading asking quotes. If you want to overlay rent per tsubo, whole-building gross yields, and live for-sale samples for any station area on one chart before you act, Urbalytics’ regional rent statistics and yield distribution tools can give you that coordinate system in minutes.#TokyoCentral3Wards #Chiyoda #Chuo #Minato #ExistingCondos #CrocodileMouth (ワニの口) #ContractPrice #REINS (Real Estate Information Network for East Japan) #GrossYield #WholeBuildingIncomeProperty (一棟収益物件) #MortgageRates #LongTermRates #JapanRealEstate #UrbalyticsReferencesMoney Post WEB / Yahoo! News, 2026, “Prices of existing condos in Tokyo’s Central 3 Wards are ‘declining’: the ‘Crocodile Mouth’ between asking and contract prices has opened wide!”, https://news.yahoo.co.jp/articles/29a2cb024b69ca68cb52844173b81beec84365b5TBS NEWS DIG “news23” / Yahoo! News, 2026, Long-term interest rates briefly at 3% for the first time since 1996—implications for mortgages and the fiscal concerns behind the move, https://news.yahoo.co.jp/articles/513f4c4dc25477c62a1890363cf7e739b76216bfYahoo! News, 2026, September mortgage rate trends: variable rates on hold; 10-year fixed and Flat 35 raised, https://news.yahoo.co.jp/articles/9d0f56636c8d51f8a90df238e29ff9a431fbc885Real Estate Information Network for East Japan (REINS), Monthly Market Watch, https://www.reins.or.jp/trend/Tomohiro Makino, “Inter-City Disparities” (Chuo Koron Shinsha, Chuko Shinsho), 2025Urbalytics (internal data: quarterly trends in rental condo rent per tsubo for Tamachi, Jimbōchō, and Ginza station areas; distribution of whole-building gross yields; as of September 2, 2026), https://www.urbalytics.jp/
A ¥288.1 Billion Hole: 'Minna de Ooyasan' Has Both Licenses Revoked, Exposing Gaps in the Real Estate Specified Joint Enterprise Act

A ¥288.1 Billion Hole: 'Minna de Ooyasan' Has Both Licenses Revoked, Exposing Gaps in the Real Estate Specified Joint Enterprise Act

The same-day license revocations in two jurisdictions revealed a ¥288.1 billion hole. What this exposes is not the Narita plot itself, but several items the Real Estate Specified Joint Enterprise Act (不動産特定共同事業法) has never required to be disclosed.On September 1, 2026, Osaka Prefecture and the Tokyo Metropolitan Government, on the same day, respectively revoked the business licenses of the operator and the distributor of the real estate fractionalization product 'Minna de Ooyasan (みんなで大家さん)'. A brand that had attracted more than 70,000 investors nationwide with a touted 7% annual yield and raised over ¥200 billion effectively reached its end the moment both licenses were revoked.For cross-border investors considering Japanese real estate fractionalization products—or those newly persuaded by pitches such as 'own remotely, no management, stable 7%'—this case is worth unpacking layer by layer. The real lesson is not how big the number is, but what the system allows.1) Narita: A stage of repeated promises that never broke groundTo understand this incident, start with Narita. As Japan’s international air gateway, the area around Narita International Airport has long been viewed as a development story waiting to be told: the third runway and airport enhancement plans are on the table, cross-border e-commerce is boosting logistics and warehousing demand, and land prices remain far below central Tokyo.The logic is not absurd. Urbalytics data show that, among listings of whole-building income properties (一棟収益物件) around Narita Station, the median gross yield (表面利回り) is about 10.0%. The average transacted unit price per tsubo in Q3 2026 is about ¥561,000/tsubo, up a cumulative 8.68% from Q3 2025—this is a market with real cash flow and gradual appreciation.The problem is that the 'Narita Series' products pointing to the 'Narita Gateway Project (成田ゲートウェイプロジェクト)' never turned that logic into a building.According to on-site reports by the Rakumachi News editorial team, the planned development site showed virtually no change between shoots in February 2024 and August 2026. The premise underpinning the entire concept—the ground lease with Narita International Airport Corporation (NAA)—expired at the end of November 2025 and has never been renewed. In other words, investors bought a Narita story, not a Narita asset.Terminal at Narita International Airport2) September 1: Two authorities pulled two licenses on the same dayThe two licenses were revoked by different authorities for different reasons. Osaka Prefecture revoked the operator 'Toshi Soken Invest Fund' license; the Tokyo Metropolitan Government revoked the distributor 'Minna de Ooyasan Hanbai' license.Osaka Prefecture cited two statutory grounds. First, violation of capital requirements (Real Estate Specified Joint Enterprise Act, Article 36, item 2): the company’s FY2025 business report, filed in July 2026, showed balance sheet net assets of negative ¥288.1 billion, failing even to meet 90% of its stated capital of about ¥2.9 billion (≈¥2.6 billion), thereby breaching the licensing standards outright.Second, violation of a 'particularly serious nature' (Article 36, item 5), which points not to the finances but to the concealment itself—detailed below.What truly makes 'repayment' meaningless is the absolute scale of funds. Investors past maturity but unpaid total 7,511 people, about ¥18.8 billion; those not yet due total 65,269 people, about ¥172.4 billion. Combined, that is just over 70,000 investors and about ¥191.3 billion with exhausted principal repayment capacity.As of end-June 2026, the company’s cash and deposits were only ¥92.41 million, equal to 0.05% of the combined amount above. Osaka Prefecture therefore concluded that repayment is in an 'extremely difficult condition'.Even if the full market value of its owned real estate reported in disclosures—¥31.4 billion—were liquidated, there would still be a gap of more than ¥150.0 billion versus the ¥188.5 billion of principal to be returned—implying a rough recovery of only about 16% of principal. The company’s assets have been attached multiple times; a parcel in Osaka’s Chuo Ward was hit with a provisional attachment order of about ¥12.0 billion in May 2026.Government district in OsakaInvestors bought a Narita story, not a Narita asset.3) The structural gap: What the Act never required to discloseReading this as merely 'a company faked it' misses the more important point. The sharpest passage in the administrative disposition explains how the framework was legally skirted.The operator, knowing that tenants under products such as 'Minna de Ooyasan Narita No. 13' had not paid rent, nonetheless recorded false statements in the pre-contract disclosure documents (契約成立前交付書面) and continued sales, raising over ¥600 million. Crucially, the representative director’s motive was found to be that disclosing rental arrears would 'heighten reputational risk and severely impair large-scale fund-raising via bond issuance'; he therefore refrained from even notifying internally.The result was that frontline sales continued processing subscriptions in total ignorance. On the distributor side, the failing was inaction—despite knowing the tenant had not paid rent, it did not investigate and delivered/explained documents likely to mislead investors, raising over ¥1.4 billion, and repeated the same violation even after an administrative instruction in 2024.So why did this continue until the day the licenses were pulled? Because the Act itself does not compel disclosure of the following:First, the basis for projected yields need not be disclosed. In legal terms, the operator has no obligation to prove where the '7% per annum' figure comes from.Second, the appropriateness of the target property’s price need not be third-party verified; the issuer can effectively mark the land or building as it sees fit.Third, the use of proceeds need not be disclosed. From the paperwork alone, investors cannot tell whether their cash bought assets or backfilled prior distributions.Fourth, the appropriateness of related-party transactions need not be disclosed. In this case, the parent company 'Toshi Soken Invest Bank' led an overseas issuance of 'insured bonds', and the underwriter of the initial US$250 million tranche was the company itself—a textbook related-party transaction. The issuance, slated to complete in October 2025, ultimately did not close.Fifth, funding plans for development-type products need not be disclosed—allowing lethal facts such as 'the land lease has expired' to sit outside investors’ field of view.Undeveloped land around Narita AirportRisk disclosure The risk in fractionalized products was never 'what yield is printed' but whether you can verify that yield. When the projected-yield methodology, asset valuation, actual use of funds, and related-party pricing all sit outside mandatory disclosure, the '7%' in investors’ hands is a promise, not a verifiable fact. If you read the annual rate as a risk indicator, you are facing the wrong direction from the start.4) Investor lens: 7% on paper vs. 10% on bricks-and-mortarBack to utility: what should an investor seeking stable cash flow in Japan take away?Start with the yield frame of reference. Urbalytics data show that, in the Narita Station area, 61 listed whole-building income properties have a median gross yield of 10.0% and an average of 10.52%, ranging from 4.0% to 32.1%. The average asking price is about ¥56.66 million, corresponding to average annual rent of about ¥4.84 million.In other words, in a market anchored by real assets, leases, and registries, around 10% is the median, and 7% is not even compelling. When a paper product that need not disclose its formula posts a figure below the area’s physical-asset median, the price is buying not yield but 'convenience'.The rent side warrants calibration as well. Urbalytics leasing statistics indicate that, in the Narita Station area, whole-building assets show average monthly rent of about ¥323,000 on average floor area of about 200.9 m², with a median rent of about ¥2,660 per m². Unit-price trends have been soft in recent quarters, but because some quarters have as few as two samples, these should be treated as reference values, not definitive trends.Yield distribution and price-per-tsubo trend for whole-building income properties in the Narita Station areaUrbalytics Insights Urbalytics can underpin this type of judgment because it is not survey- or sentiment-based. It aggregates actual listings and transactions, and leasing records, then computes distributions: the 61-sale-sample yield range and the 22-lease-sample median unit rent can each be traced to a specific address and property. Because the sample size is explicitly shown, readers can judge which quarters are merely reference values and which constitute a trend—precisely what a fractional product’s 'projected yield' cannot provide.Conclusion: Swap '7%' for three actions you can verify yourselfThis case will not end with two revoked licenses. Roughly 2,500 investors nationwide are pursuing a collective action totaling about ¥23.2 billion; the Osaka District Court has already ordered refunds totaling about ¥800 million across three rulings. The operator scarcely contests the repayment obligation, instead requesting installment plans on grounds of cash flow. The next focal points are whether the operator and its parent will enter bankruptcy, civil rehabilitation, or special liquidation.Policy will not stand still either. When a product that raised roughly ¥200 billion can, within the regulatory framework, legally avoid disclosing the basis of its projected yield, asset valuation, and related-party transactions, reform pressure is only a matter of time. Expect disclosure of the basis for projected yields and related-party dealings to sit at the core of the next round of Real Estate Specified Joint Enterprise Act discussions.But for investors, waiting for reform is not a strategy. Until then, three immediate and effective safeguards are: review the operator’s annual financial statements for net assets rather than merely distributions; request the calculation basis for projected yields and market-value materials for the target assets—treat non-provision as a red flag; and map out related-party structures, especially 'self-underwriting' arrangements.None of these are fun, but they are the last line of defense. If you want to benchmark yields and rent levels for an area using actual listings and leasing records before you act, Urbalytics’ area yield and rent tools can give you that frame of reference in minutes.#みんなで大家さん #RealEstateSpecifiedJointEnterpriseAct #Narita #ChibaInvestment #Tokyo #OsakaPrefecture #AdministrativeSanctions #RealEstateFractionalization #RealEstateCrowdfunding #InvestmentRisk #JapanRealEstate #GrossYield #DueDiligence #UrbalyticsReferencesRakumachi News, 2026, 'Minna de Ooyasan'—Osaka Prefecture and Tokyo revoke licenses; liabilities exceed ¥288.1 billion, https://www.rakumachi.jp/news/column/405953Yomiuri Shimbun Online, 2026, Two firms related to 'Minna de Ooyasan': Osaka Prefecture and Tokyo revoke business licenses; operator faces difficulty in repaying investors, https://www.yomiuri.co.jp/national/20260901-GYT1T00331/Asahi Shimbun, 2026, 'Minna de Ooyasan' distributor and operator: Tokyo and Osaka Prefecture revoke business licenses, https://news.yahoo.co.jp/articles/d650263d28e9d711ec55a097a825762826aefc43Mainichi Shimbun, 2026, 'Minna de Ooyasan'—Osaka Prefecture revokes operator’s business license, https://news.yahoo.co.jp/articles/b0be1477cdf9b1fca7b10dd50fc2de44e6d40bc2Kansai TV, 2026, Real estate fund 'Minna de Ooyasan' effectively ends operations: negative net worth and failure to honor redemption promises, https://news.yahoo.co.jp/articles/da595b32e1690211ccf72874b8c05049d77795a6e-Gov Law Search, Real Estate Specified Joint Enterprise Act, https://laws.e-gov.go.jp/law/406AC0000000077Urbalytics (internal data: Narita Station area whole-building income properties—gross yield, price per tsubo, rent statistics, as of September 1, 2026), https://www.urbalytics.jp/
03-4566-3208Contact