When Is the Best Time to Sell an Apartment? Five Key Factors: Building Age, Interest Rates, Yield, Occupancy, and Holding Period
Eiichi Suto (licensed real estate broker, 宅地建物取引士)Real Estate Brokerage / Renovation
19 min read
"Should I sell my apartment soon, or hold on a bit longer?" Many owners consider the timing of a sale when the building ages or interest rate news continues. However, the best time to sell is not decided by just one reason such as "the market is high this year."
This article organizes five key factors to judge the timing to sell an entire apartment building and what to check for each. The yield market data uses Urbalytics’ Tokyo sales listings (aggregated on October 2, 2026), showing figures by station and building age band.
Key Points of this Article
- For one-building listings under 400㎡ total floor area at 6 Tokyo stations, the median gross yield ranged from 4.2% to 5.3% (October 2026 aggregation, Urbalytics listing data).
- Looking at 3 stations—Kita-Senju, Kamata, and Akabane—median yields by building age showed trends: 4.5% within 5 years of age, rising to 6.1% for 31+ years old.
- Capital gains tax rates differ depending on whether the holding period exceeds 5 years as of January 1 of the sale year: approximately 20% or 40% (tax rates as of 2026).
Consider Apartment Sale Timing Across Five Factors
Pragmatically, the best time to sell an apartment is judged by layering five factors: "building age," "interest rates," "yield market," "occupancy," and "taxes." Even if one factor is favorable, other conditions can significantly affect net income.
| Factor | What to Check | Example of When to Consider Selling |
|---|---|---|
| Building Age | Remaining years of legal useful life | Before remaining years become shorter than buyer’s loan term |
| Interest Rates | Trends in policy interest rates and investment loan rates | Before buyer’s borrowing conditions sharply worsen |
| Yield Market | Sale yield around nearest station/area | When market yields are low (= prices relatively high) |
| Occupancy Rate | Whether fully rented and rent at market level | When near full occupancy and rent rolls are in good order |
| Holding Period | Whether more than 5 years as of January 1 | Year when long-term capital gains tax rate applies |
Below covers each factor in detail. How appraisal values are determined is explained in detail at How the Appraisal Price of an Entire Apartment Building Is Determined: Income Capitalization Approach.
Building Age: Remaining Legal Useful Life Influences Buyer Loan Terms
The biggest effect of building age is on the loan term a buyer can secure. Many financial institutions tend to set the loan term roughly as "legal useful life minus building age," and a shorter remaining term increases a buyer’s monthly repayments, limiting the pool of potential buyers.

The legal useful life for residential buildings is: wood construction 22 years; lightweight steel frame (frame thickness over 3mm up to 4mm) 27 years; heavy steel frame (over 4mm) 34 years; reinforced concrete 47 years. For example, a 15-year-old wooden apartment has a remaining life of 7 years. This number alone does not determine loan approval; some banks may allow terms beyond the useful life based on building condition or land appraisal. Still, it is generally true that shorter remaining life means fewer options.
On the other hand, wooden apartments past their legal useful life can sometimes be viewed positively by individual buyers for tax purposes, as they can apply depreciation over a shorter period (the simplified method uses 20% of legal useful life—4 years for wood). Which way the evaluation goes depends on the buyer type. For the bank evaluation mechanism, see also Relationship Between Income Property Prices and Bank Valuations.
Interest Rates: Policy Rate Increased to 1.25% in September 2026
At the Bank of Japan’s Monetary Policy Meeting on September 18, 2026, the target for the uncollateralized overnight call rate was raised from about 1.0% to about 1.25% (effective from September 24, BoJ official release). This followed a hike in June.
Many variable-rate real estate investment loans link to short-term reference rates, so a rise in policy rates can increase buyer repayment burdens. Higher borrowing costs may lead buyers to demand higher yields from the same property, which can push prices down. However, higher rents might offset this effect, so market direction is not determined solely by interest rates.
In fact, Urbalytics’ public market report shows that from May to September 2026, median gross yields for entire income properties rose from 4.30% to 4.60% at Akabane Station, and from 4.74% to 5.01% at Kamata Station, but dropped from 4.75% to 4.00% at Kita-Senju Station, showing varied movement by station (note that monthly data counts are low at 11–19 cases, so one transaction change can shift trends).
Yield Market: Gross Yields by 6 Tokyo Stations and Building Age Bands
To consider the best time to sell, start by knowing "what yield is being offered for sale near your property." Lower market yields mean higher evaluated prices for the same rental income.
| Nearest Station | Number of Listings | Median Gross Yield | Average Gross Yield |
|---|---|---|---|
| Kinshicho | 24 | 4.2% | 5.3% |
| Nakano | 37 | 4.4% | 4.8% |
| Nerima | 16 | 4.7% (small sample, reference value) | 5.6% |
| Akabane | 25 | 4.8% | 5.9% |
| Kamata | 40 | 5.1% | 5.3% |
| Kita-Senju | 43 | 5.3% | 5.7% |
Source: Urbalytics (listings of entire income properties). Tokyo metro area, total floor area under 400㎡, listings with price or listing status changes between October 2, 2025, and October 2, 2026; duplicate listings across multiple sites removed (gross yields under 1% or above 25% excluded). Gross yield = annual expected income ÷ listing price. Data as of October 2, 2026.
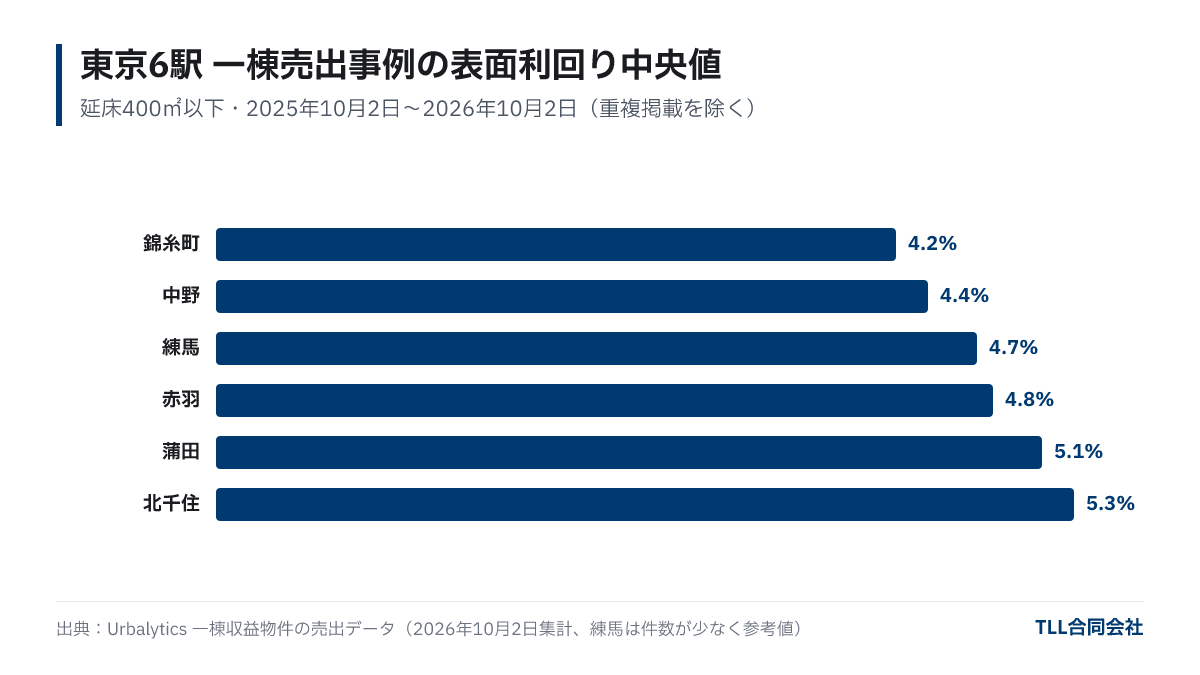
Many stations show an average yield above the median because properties with older buildings, leasehold land, or rebuilding restrictions push average yields higher. For market analysis, the median is a better benchmark for actual conditions.
Next, from the same data, we extracted listings near Kita-Senju, Kamata, and Akabane stations, consolidated duplicate listings of the same property, and grouped yields by building age band.
| Building Age Band | Number of Listings | Median Gross Yield |
|---|---|---|
| Within 5 years (including planned new builds) | 23 | 4.5% |
| 6–15 years | 22 | 5.2% |
| 16–30 years | 7 | 5.1% (small sample, reference) |
| 31 years or older | 32 | 6.1% |
| Total for 3 stations | 84 | 5.1% |
Source: Urbalytics (listings of entire income properties). Properties near Kita-Senju, Kamata, and Akabane stations in Tokyo under 400㎡ floor area with prices recorded from January to September 2026. Cases with zero or unknown annual income and duplicate listings were excluded by TLL. Building age = 2026 minus construction year. Data as of October 2, 2026.
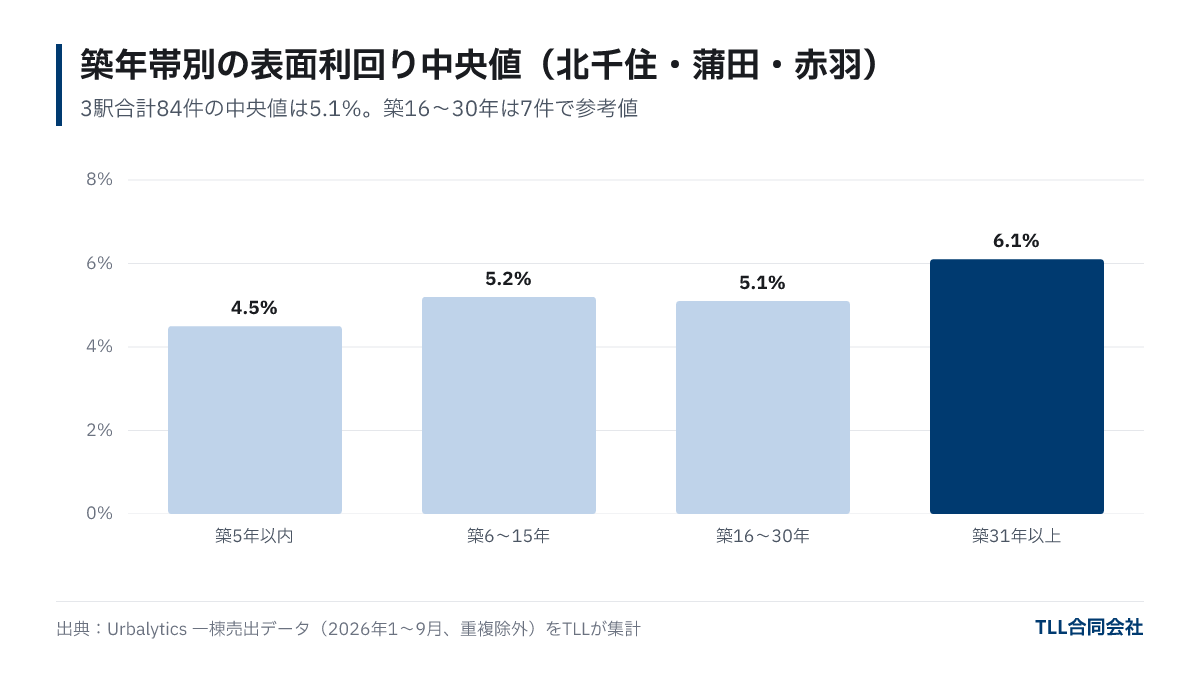
The increase in yield with building age (implying lower prices relative to income) reflects incorporation of shorter loan terms and repair risks into price. The gap between median yields for 6–15 years and 31+ years is about 0.9 points, which for a property earning 8 million yen yearly equates to approximately 154 million yen at 5.2% yield versus 131 million yen at 6.1% yield.
Occupancy Rate: Near Full Occupancy Is More Favorably Valued
The price of an entire apartment building is based on rental income. If listed with many vacancies, buyers and lenders rigorously examine whether the rent can realistically be achieved. Even if rent is presented as fully rented, if there is no supporting lease or occupancy history, evaluation is often based on current income.

Besides occupancy, check how current rents compare with the local market. According to Urbalytics rental listing data, the median rent per sqm for units under 30㎡ is about 4,390 JPY/㎡ at Kita-Senju (413 listings), about 4,430 JPY/㎡ at Kamata (capped at 500 listings for aggregation), and about 3,850 JPY/㎡ at Akabane (277 listings) (aggregated October 2, 2026, based on listing rents). If your property’s rents are significantly lower, consider revising rents before selling. If significantly higher, expect buyers to point out the risk of rent declines after vacancies.
Whether to fill vacancies before selling or sell as-is is discussed further at Apartment Vacancy Measures and Comparison of Direct Purchase and Brokerage.
Holding Period: Whether Ownership Exceeds 5 Years as of January 1 of the Sale Year
For individuals, capital gains from real estate sales are classified as long-term if ownership exceeds 5 years as of January 1 of the sale year, otherwise short-term. Tax rates as of 2026 are: long-term 20.315% (income tax 15%, special reconstruction tax 0.315%, resident tax 5%), short-term 39.63% (income tax 30%, special reconstruction tax 0.63%, resident tax 9%).
Note that the test is not "5 years from acquisition date" but "ownership exceeding 5 years as of January 1 of the sale year." For example, a property acquired in October 2021 sold in 2026 is considered short-term (4+ years as of January 1), but selling in 2027 is long-term (exceeds 5 years). Changing the sale year by one can significantly affect the tax amount if there is capital gain.

For corporations, this classification does not apply; capital gains are included in corporate tax calculations. For individual tax amounts, consult a tax advisor. The overall sale process and costs are summarized at Income Property Sale Process.
Frequently Asked Questions
Q. Up to what building age is it best to sell an apartment?
There is no one-size-fits-all answer, but for wooden buildings, shorter remaining legal useful life (22 years total) tends to limit buyer loan terms. Yields by age band are also higher after 31 years (median 6.1%), so checking the market early provides useful reference.
Q. Do apartment sale prices drop when interest rates rise?
Rising borrowing costs can put downward pressure on prices, but rent trends and buyer financial conditions influence results. Public data from May–September 2026 showed mixed trends: yields rose at some stations and fell at others.
Q. Can I sell an apartment with vacancies?
You can, but valuations vary depending on how vacancy income is estimated. Whether to fill vacancies before selling or sell as-is depends on comparing the time and cost to fill vacancies.
Q. When is the 5-year holding period measured?
It is measured on January 1 of the sale year. Even if sold the day after 5 full years from acquisition, if January 1 hasn’t passed 5 years, it is treated as short-term capital gains.
Summary
- Apartment sale timing is best judged by layering five factors: building age, interest rates, yield market, occupancy, and holding period.
- For Tokyo’s 6 stations in listings under 400㎡ total floor area, median gross yields ranged 4.2%–5.3%; for 3 stations by building age: within 5 years 4.5%, 31+ years 6.1% (October 2026 data).
- The Bank of Japan raised the policy rate to about 1.25% in September 2026; buyer borrowing conditions require attention.
- Individuals’ capital gains tax rates are 20.315% if held over 5 years as of January 1 of sale year, 39.63% otherwise (2026 rates).
If you want to estimate how your property might be evaluated and which factors are influencing it, try a free appraisal for each property.
Featured image (illustration): Photo: Fumiaki Hayashi / Unsplash
About this article
- Author
- Eiichi Suto(Real Estate Brokerage / Renovation)Qualifications: Real Estate Transaction Specialist, General Insurance Solicitor Qualification, Assistant Commercial Facilities Planner, Level 2 Assistant Landscape Construction Management Engineer, Level 1 Assistant Civil Engineering Construction Management Engineer
Brings over 20 years of experience in the real estate industry, working across central Tokyo and the broader Greater Tokyo area on acquisitions and sales of income-producing and commercial properties. Leverages an inter-broker network to uncover off-market opportunities, assess asset quality, and evaluate project profitability, while developing diverse sourcing channels ranging from whole-building investment assets to value-add opportunities. Has consistently led the process from acquisition decisions through resale strategy and renovation planning, building high-conviction deals with strong execution potential.
View profile → - Publisher
- TLL合同会社宅地建物取引業 東京都知事(1)第108202号住宅宿泊管理業 国土交通大臣(01)第F03424号
Data in this article cite their source and as-of date. Market conditions and regulations change, so check the latest information and consult a professional before deciding. Translated from the Japanese original.