Tokyo 23 Wards Ranking of Gross Yield for Entire Income Properties【September 2026】Levels and Year-on-Year Comparison by Ward
Chen Tan (licensed real estate broker, 宅地建物取引士)Founder
19 min read
"What is the current yield in the ward where my apartment is located?" "Has it increased or decreased compared to one year ago?" These are common questions from owners beginning to consider selling or replacing their property. Gross yield roughly measures the price level of a property, so knowing the level by ward and the year-on-year trend offers clues to assess the appropriateness of appraisal values and listing prices.
This article organizes the gross yield by ward for entire income properties in Tokyo's 23 wards, based on the publicly available market report (September 2026 aggregation) from Urbalytics, a real estate data service operated by TLL LLC. Note that the figures are based on "listing prices" of properties currently on the market, not on transaction prices.
Key points of this article
- The median gross yield for entire income properties by ward in Tokyo's 23 wards in September 2026 shows Katsushika Ward at 5.63% being the highest and Chuo Ward at 2.77% the lowest, with a difference of approximately 2.9 percentage points (Urbalytics Market Report, listing data).
- The median gross yield for all Tokyo decreased 16 basis points from 5.16% in September 2025 to 5.00% in September 2026, with yields lower than the previous year in 15 out of the 23 wards.
- Wards with the largest year-on-year drops were Chuo Ward and Nakano Ward (both −75bps) and Shinagawa Ward (−61bps). Wards seeing the largest increases were Nerima Ward (+51bps) and Bunkyo Ward (+42bps).
Ranking of Gross Yield for Entire Income Properties in Tokyo 23 Wards (September 2026)
As of September 2026, the wards with the highest gross yields were Katsushika Ward (5.63%), Nerima Ward (5.58%), and Adachi Ward (5.50%), while the lowest were Chuo Ward (2.77%), Minato Ward (3.20%), and Chiyoda Ward (3.45%). The arrangement that yields tend to be higher in outer wards of Eastern and Northern Tokyo and lower in central wards directly reflects the differences in price levels.
Gross yield is defined as "annual rental income ÷ listing price." If rents are the same, higher prices result in lower yields. Therefore, wards with low yields can be read as "wards where prices are high relative to rents," and wards with high yields as "wards where prices are relatively restrained against rents." This number is before deducting expenses or vacancy and is not the actual net yield.
| Rank | Ward | Sep 2026 | Number of Listings | Sep 2025 | Number of Listings | Year-on-Year Change |
|---|---|---|---|---|---|---|
| 1 | Katsushika Ward | 5.63% | 94 listings | 5.67% | 60 listings | −4bps |
| 2 | Nerima Ward | 5.58% | 110 listings | 5.07% | 88 listings | +51bps |
| 3 | Adachi Ward | 5.50% | 117 listings | 5.68% | 141 listings | −18bps |
| 4 | Edogawa Ward | 5.27% | 93 listings | 5.43% | 108 listings | −16bps |
| 5 | Itabashi Ward | 5.27% | 131 listings | 5.38% | 110 listings | −11bps |
| 6 | Koto Ward | 5.11% | 61 listings | 4.76% | 52 listings | +35bps |
| 7 | Arakawa Ward | 5.06% | 64 listings | 5.04% | 48 listings | +2bps |
| 8 | Ota Ward | 5.01% | 121 listings | 5.00% | 99 listings | +1bps |
| 9 | Nakano Ward | 4.83% | 125 listings | 5.58% | 109 listings | −75bps |
| 10 | Kita Ward | 4.82% | 73 listings | 5.14% | 60 listings | −32bps |
| 11 | Suginami Ward | 4.76% | 122 listings | 4.68% | 123 listings | +8bps |
| 12 | Sumida Ward | 4.64% | 77 listings | 4.72% | 59 listings | −8bps |
| 13 | Toshima Ward | 4.58% | 108 listings | 4.50% | 105 listings | +8bps |
| 14 | Taito Ward | 4.53% | 90 listings | 4.40% | 76 listings | +13bps |
| 15 | Shinagawa Ward | 4.38% | 47 listings | 4.99% | 51 listings | −61bps |
| 16 | Setagaya Ward | 4.34% | 138 listings | 4.67% | 112 listings | −33bps |
| 17 | Shinjuku Ward | 4.21% | 127 listings | 4.29% | 89 listings | −8bps |
| 18 | Bunkyo Ward | 4.12% | 39 listings | 3.70% | 33 listings | +42bps |
| 19 | Meguro Ward | 3.82% | 39 listings | 4.03% | 31 listings | −21bps |
| 20 | Shibuya Ward | 3.53% | 56 listings | 3.93% | 44 listings | −40bps |
| 21 | Chiyoda Ward | 3.45% | 38 listings | 4.02% | 16 listings | −57bps |
| 22 | Minato Ward | 3.20% | 43 listings | 3.33% | 32 listings | −13bps |
| 23 | Chuo Ward | 2.77% | 33 listings | 3.52% | 24 listings | −75bps |
Source: Urbalytics Market Report (By Area - Tokyo, Entire Income Properties by Ward). Subjects are monthly medians of listing information (both active and contracted) for entire income properties collected by Urbalytics, excluding outliers by IQR method. Listing counts are data counts for the month. bps = 0.01 points. Data month: September 2026 (viewed October 2, 2026).
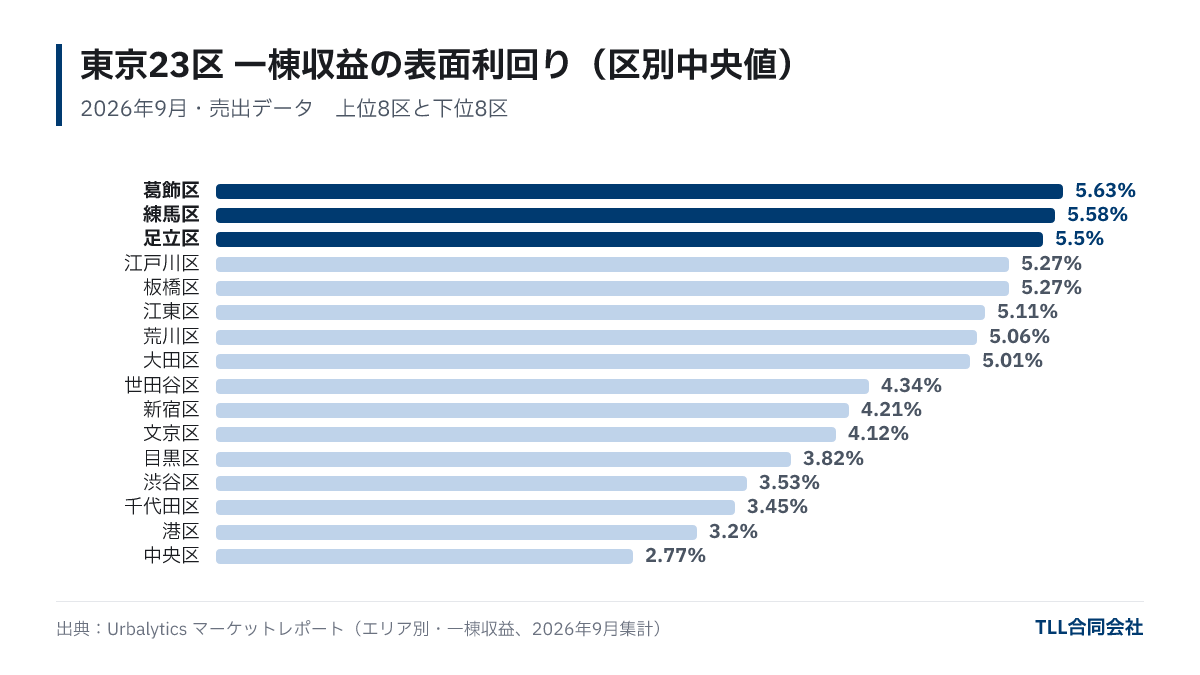
The median gross yield for all Tokyo (including the 23 wards, Tama area, and islands) was 5.00% in September 2026 (2,394 data points). Eight wards exceeded the Tokyo average within the 23 wards: Katsushika, Nerima, Adachi, Edogawa, Itabashi, Koto, Arakawa, and Ota.
Wards With Significant Year-on-Year Yield Movement
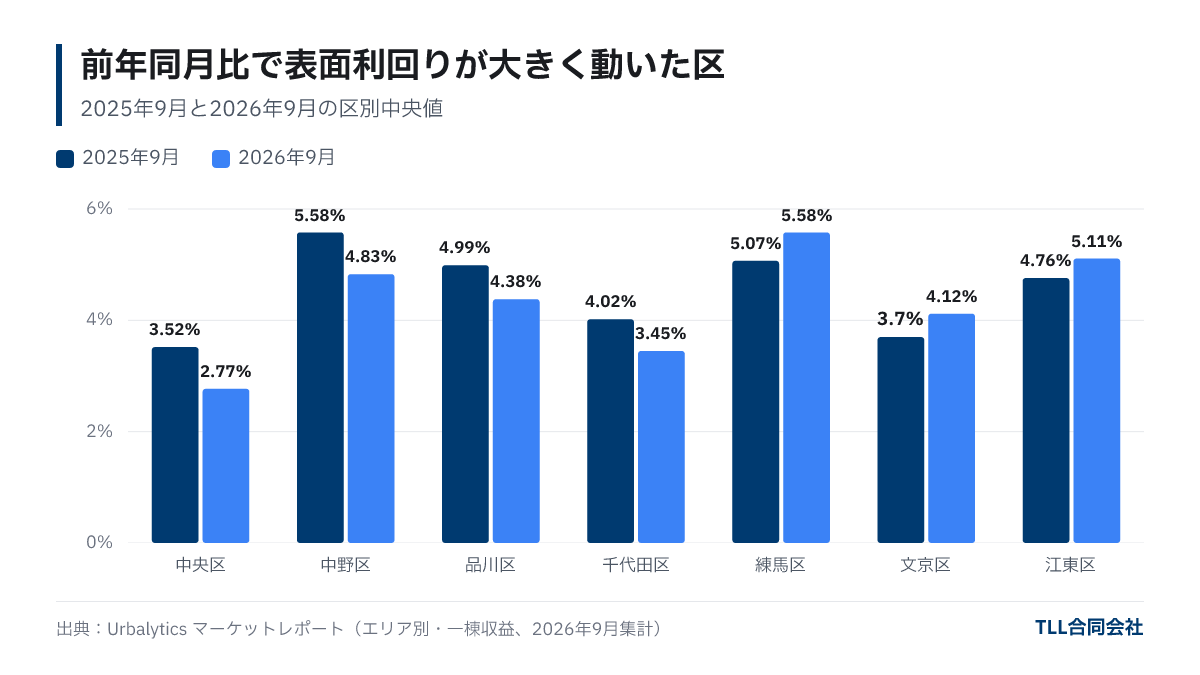
Compared to September 2025, 15 of the 23 wards saw decreases in gross yield, and 8 saw increases (with Arakawa +2bps and Ota +1bps being almost flat). Large decreases were observed in Chuo Ward (3.52% → 2.77%), Nakano Ward (5.58% → 4.83%), Shinagawa Ward (4.99% → 4.38%), and Chiyoda Ward (4.02% → 3.45%). Increases occurred in wards such as Nerima (5.07% → 5.58%), Bunkyo (3.70% → 4.12%), and Koto (4.76% → 5.11%).
There are mainly two possibilities behind falling yields. One is that listing prices increased while rents remained unchanged. The other is a changed composition of listed properties; for example, if the share of new or recently built properties or those close to stations rises, the median yield tends to drop. Since the median reflects the "middle value of properties listed that month," changes in market conditions and property composition both affect the figure.
Paying attention to the number of listings is also important. In September 2025, Chiyoda had only 16 listings and Chuo had 24, so the median can shift considerably with changes in just 1–2 properties. The ward pages on Urbalytics also note that for months with about 10–30 listings, the median will shift with the addition or removal of a single listing. Thus, it is recommended to consider listing counts along with large changes.
Why Did Yields Move? Possible Factors
From this data alone, it is impossible to attribute yield changes to one cause. Generally, possible factors are as follows.
- Price changes: If sellers raise listing prices, yields fall assuming rents stay the same. This may be a factor behind yield decreases in central wards such as Chuo and Chiyoda, as well as Nakano and Shinagawa.
- Changes in property composition: When many new or recently built large properties are listed in a month, median yield tends to fall. Conversely, if many older or small-scale properties are listed, yields tend to rise.
- Rental changes: If rents rise while prices remain stable, yields increase. Whether the rises in Nerima and Koto wards are due to this is unclear from this aggregation alone.
- Interest rates and financing conditions: Generally, higher borrowing rates drive buyers to demand higher yields, which tends to suppress price increases. However, this data does not reveal a relationship strong enough to explain differences among wards.
Each ward’s page also publishes trend data for listing prices, building price per tsubo (3.3 sqm), and building area. For example, if building area medians shift significantly in wards where yields fell, it suggests property composition changes play a large role. The article "How Are Appraisal Values of Entire Apartment Buildings Determined?" also explains how to interpret prices and yields.
What Owners and Investors Should Check
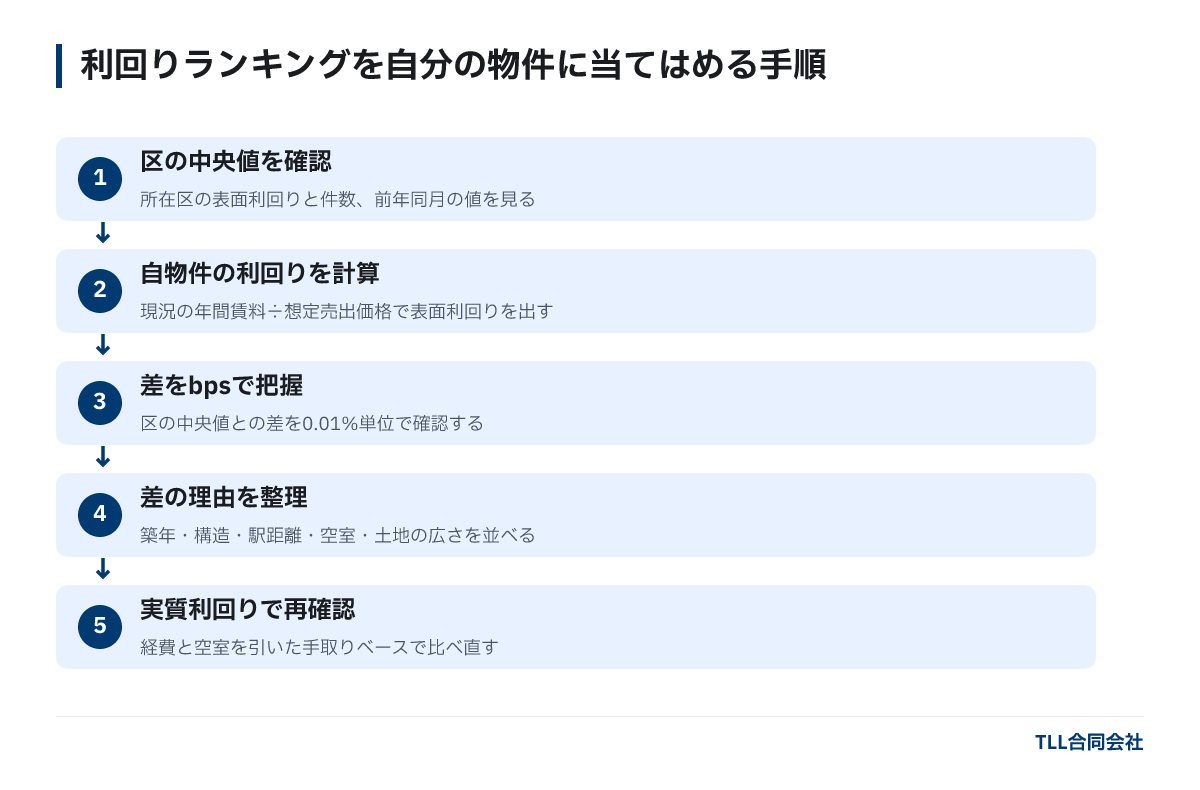
The ward ranking is a starting point to understand where your property stands. Checking in the following order makes the ranking more useful for actual decisions.
- Confirm the median and number of listings in your ward: Look at your ward’s values and listings for September 2026 and the same month last year in the table above.
- Calculate your property's gross yield: Divide current annual rent by the assumed listing price. Decide whether to calculate based on full occupancy assumption or current occupancy, as this affects the figure.
- Understand the difference to the ward median in 0.01 point (bps) units: If your property’s yield is lower than the ward median, it suggests a relatively high price; if higher, a relatively low price.
- Clarify reasons for differences: List factors such as building age, structure, distance to stations, vacancy, and land size/shape that explain the gap with the ward median.
- Check with net yield: Compare on a net basis after deducting management fees, repair costs, fixed asset tax, and vacancy.
If you are considering selling, the ward median is only a reference; actual prices vary greatly by individual conditions. TLL’s free appraisal explains price concepts for each property based on surrounding listing/sale cases and rent levels. The overall selling process is summarized in "Income Property Selling Process."

Frequently Asked Questions
Q. Is this yield figure based on transaction prices?
No. It is the median gross yield based on listing prices collected by Urbalytics (including active and closed listings). Actual transaction prices are often lower than listing prices, so transaction-based yields tend to be higher than these figures.
Q. Does a drop in yield mean prices increased?
If rents remain steady, a yield decline signifies price increases. However, since the median changes due to the composition of listed properties, a decrease in yield does not necessarily mean the market price has risen.
Q. Can the data for wards with few listings be trusted?
For months with 10–30 listings, the median can shift due to the addition or removal of 1–2 properties. Wards with few listings, such as Chiyoda (16 listings in September 2025) or Chuo (24 listings), should be viewed along with trends in adjacent months for reliability.
Q. If my property’s yield is lower than the ward median, does that mean it will be harder to sell?
Not necessarily. There are conditions like being newly built, close to stations, or having large land that can attract buyers even with a yield lower than the median. It is recommended to check pricing approaches based on individual conditions through an appraisal.
Summary
- In September 2026, the median gross yield for entire income properties by ward in Tokyo’s 23 wards ranged from 5.63% in Katsushika Ward (highest) to 2.77% in Chuo Ward (lowest).
- The median for all Tokyo declined by 16bps year-on-year (5.16% → 5.00%), with yields falling in 15 wards out of the 23.
- Significant declines occurred in Chuo (-75bps) and Nakano (-75bps) wards, Shinagawa (-61bps), while yield increases were recorded in Nerima (+51bps) and Bunkyo (+42bps) wards, with the possibility of mixed causes including price and property composition changes.
- It is important to compare your property’s yield with the ward median, organize reasons for differences, then confirm with net yield and individual appraisals.
Featured image (image): Photo: George Kedenburg III / Unsplash
About this article
- Author
- Chen Tan(Founder)Qualifications: Real Estate Transaction Specialist, Building Management Specialist, US Certified Buyer's Agent
A serial entrepreneur spanning real estate investment, fund formation, and digital strategy. At McKinsey & Company, he led organizational restructuring, DX, and new business strategy projects for financial institutions and real estate developers across Japan and Greater China. At Amazon Japan, he served as the design lead for large-scale e-commerce products. Since founding TLL, he has overseen the full cycle from acquisition, repositioning, and operation of income-producing properties to fund formation, while building a data-driven investment decision model.
View profile → - Publisher
- TLL合同会社宅地建物取引業 東京都知事(1)第108202号住宅宿泊管理業 国土交通大臣(01)第F03424号
Data in this article cite their source and as-of date. Market conditions and regulations change, so check the latest information and consult a professional before deciding. Translated from the Japanese original.