
Chen Tan

Chen Tan

Founder

A serial entrepreneur spanning real estate investment, fund formation, and digital strategy.

Overview

At McKinsey & Company, he led organizational restructuring, DX, and new business strategy projects for financial institutions and real estate developers across Japan and Greater China. At Amazon Japan, he served as the design lead for large-scale e-commerce products. Since founding TLL, he has overseen the full cycle from acquisition, repositioning, and operation of income-producing properties to fund formation, while building a data-driven investment decision model.

Experience & education

Professional Experience

McKinsey & Company

Amazon

Education

National University of Singapore - BA.Computer Engineering

IE Business School - MBA

Certification

Real Estate Transaction Specialist

Building Management Specialist

US Certified Buyer's Agent
TLL Columns

Articles on Urbalytics

Four in ten Tokyo resale condos have cut their price, and price cuts are up 57% in a year

Four in ten Tokyo resale condos have cut their price, and price cuts are up 57% in a year

At the end of September 2026, 41.0% of the resale condominiums on the market in Tokyo's 23 wards had cut their asking price at least once in the previous three months. That is almost 6 points above the 35.1% of a year earlier, and the highest reading in the 13 months we tracked.The "price-cut share" here is the share of resale condos with a listing record in the last three months whose asking price fell below its previous record. It counts how many listings were cut. It is not a measure of how far market prices have fallen.The price-cut share hit 41%, the highest in a yearTokyo 23 wards: share of resale condos with a price cut, monthly (Source: Urbalytics asking-price data, compiled Oct 2026)From autumn 2025 to April 2026 the share climbed steadily from about 35% to 39%. It dipped to 31% in June and July because a wave of new listings arrived that had not yet reached the point of cutting. In August and September those listings started to cut, and the share rose back to 41%.More listings and more cuts: buyers are gaining room to negotiateListings up 34%, price cuts up 57% (Source: Urbalytics asking-price data, compiled Oct 2026)Putting listings and price cuts side by side makes the shift clear. Over the year, resale condos for sale rose from 24,455 to 32,786, up 34%. Listings with a price cut rose from 8,588 to 13,455, up 57%.More listings mean more owners want to sell. Cuts growing faster than listings mean more of those units are not selling at their first price. When both rise together, deals are slowing and buyers gain room to negotiate.The cuts themselves are still small. The median cut has stayed at 4.4% to 4.6%, about 4.5 million yen on a 100-million-yen unit; sellers are testing the market, not dumping. Prices also remain high: according to Tokyo Kantei, the average asking price for a resale condo in the 23 wards (70 square meters) was 127.41 million yen in June 2026, down 0.8% month on month for the first time in 26 months, but still 23.3% above a year earlier.Cuts concentrate in central Tokyo: half of listings in Chuo and MinatoShare of resale condos with a price cut, by ward, 3 months to Oct 7, 2026 (Source: Urbalytics asking-price data)By ward (three months to October 7), 42.7% of listings across the 23 wards had cut their price. Chuo (50.4%), Minato (49.6%) and Shibuya (49.4%) lead, and the three central wards of Chiyoda, Chuo and Minato together stand at 49.2%, nearly one listing in two. Adachi is lowest at 34.7%. Cuts are also deeper in the center, 5.3% in Chuo and 5.2% in Minato, against 4.2% to 4.6% in most outer wards. The more expensive the ward, the earlier the adjustment.What this means for buyers, sellers and investorsBuyers: In central Tokyo, half of listings cut their price within three months, by about 5% at a time. The longer a unit has been on the market, the more room there is to negotiate.Sellers: Listing at peak-period prices in central Tokyo carries close to a one-in-two chance of cutting within three months. Recent listings and cuts in the same building or around the same station are a more realistic guide than last year's sale prices.Investors: How much rental yields improve once asking prices come down is covered in a later article in this series.Log in to Urbalytics to see more condo price history and transaction recordsMethodologyResale condominiums in Tokyo's 23 wards. Listings = units with a listing record in the 90 days to each date. Price cut = any asking price in those 90 days below the previous record. Cut size = the median of each listing's largest cut within the 90 days. All figures are asking prices, not transaction prices. Data: Urbalytics asking-price data, compiled October 2026.Tags: Tokyo property prices, Tokyo resale condos, price cuts, Tokyo 23 wards, Minato condos, Chuo condos, central Tokyo, buying property in Japan, Japan real estate investment, asking prices, Tokyo Kantei, UrbalyticsReferencesTV Tokyo BIZ, "Tokyo 23-ward resale condo prices fall as buyers can't keep up" (July 23, 2026). https://txbiz.tv-tokyo.co.jp/wbs/news/post_345328Bloomberg via Yahoo! News Japan, "Tokyo 23-ward resale condo prices fall for first time in 26 months" (July 23, 2026). https://news.yahoo.co.jp/articles/15984b952eaac4f80cceae31089aa7397ed95d40Cover image: AI-generated illustration (Higgsfield)
Same Price, Second Knock: Why the Former Murakami Fund Group Wants to Buy Sankei REIT

Same Price, Second Knock: Why the Former Murakami Fund Group Wants to Buy Sankei REIT

The former Murakami fund group relaunched its bid at the exact same JPY 125,000 per unit as the failed previous round, betting on the gap between listed REIT discounts and private-market cap rates.On September 25, 2026, TSE-listed Sankei Real Estate Investment Corporation (hereafter “Sankei RE”) announced it supports the tender offer (TOB) launched by City Index Fifth, an investment company affiliated with the former Murakami fund group, while leaving the decision to tender to unitholders.The offer price is JPY 125,000 per unit, an 18.93% premium to the prior day’s close of JPY 105,100. The figure is not new: from January to May this year, Tosei and Singapore’s GIC offered the same JPY 125,000 in a TOB that ultimately failed due to insufficient tenders.Same price, second knock. This time the buyer—and the math—have changed. For investors focused on Tokyo office and hotel assets, the question is less who wins and more how listed REITs are being repriced.I. From Tosei to the former Murakami group: a nine‑month takeover sagaTimeline first. On January 6, 2026, Tosei and GIC, via two investment limited partnerships, announced a TOB plan; Sankei RE immediately expressed support and recommended tendering. Starting January 7, the former Murakami group steadily bought investment units in the secondary market.The first TOB period was extended six times; by the May 18 deadline, tenders totaled 138,376 units, below the 247,563-unit minimum, and the offer failed. The former Murakami group already held about 26.12% then—becoming the blocking stake in the middle.On August 4, the former Murakami group submitted an indication of interest, again at JPY 125,000. Sankei RE set up a special committee, asking the bidder to set a minimum tender threshold and raise price; the threshold was accepted, price unchanged. Both sides announced on September 25.The TOB runs from September 28 to November 10, with a minimum of 118,732 units, no upper limit, and funding entirely from own capital without bank loans. If successful, the bidder plans to complete a squeeze-out (スクイーズアウト) and delist by end-February 2027.Hibiya Sankei Building, one of the office properties Sankei RE holds in Chiyoda WardII. Why now: the sponsor’s parent may change hands as the REIT trades at a discountThe starting point is not the REIT itself but its sponsor. Sankei RE’s sponsor is Sankei Building, whose parent is Fuji Media Holdings.The former Murakami group began buying Fuji Media shares and engaging from January 2025. On February 3, 2026, Fuji Media announced it was studying “bringing in external capital” for its urban development and tourism businesses. Citing media reports, the TOB notice states Sankei Building has received acquisition interest exceeding JPY 1 trillion, with a buyer possibly to be decided within the year.The group’s critique is straightforward: with the parent poised to change hands, the REIT supported Tosei’s plan without a competitive process. In their view, a new owner may value the REIT’s hotel assets; future asset buybacks or a reworked capital relationship could justify a higher price.The market backdrop has also shifted. From the prior TOB announcement to the day before this one, the TSE REIT Index fell from 2,029.82 to 1,739.64, down about 14.3%; the 10Y JGB yield rose from 2.12% to 2.99%. Rising rates have compressed REITs’ relative appeal, pushing unit prices lower.Tokyo Sankei Building, the headquarters of sponsor Sankei BuildingIII. The 41% arithmetic: how this minimum threshold was setThe TOB’s most instructive element is its minimum condition. Passing a squeeze-out via unit consolidation requires two-thirds of votes cast at a unitholders’ meeting, but the bidder does not intend to buy up to two-thirds.The bidder’s math has three steps:First, actual voting participation at the last two unitholder meetings was about 69% and 71%. Most non-voters are retail unitholders, so the maximum participation is estimated at about 85%, implying the approval votes needed would be roughly 57% of all units.Second, passive investors such as index funds are estimated to hold about 15.20%. They typically do not tender into TOBs but tend to vote in favor of squeeze-out resolutions.Third, net of passive funds, the bidder would need to hold about 41% to pass the resolution; hence it set the post-TOB minimum holding at 45%, further deducting the 19.58% held by ATRA and Aya Nomura, who are not expected to tender.Another red line is the conduit requirements (導管性要件). If the bidder tops 50% while the REIT remains listed, the REIT could lose tax-exempt treatment on distributions—imposing an additional tax burden on remaining unitholders. The 45% minimum is designed to avoid such “tender or be penalized” coercion.IV. From the public market to the private market: Urbalytics data on the gapOn the same day, Sankei RE also announced an asset sale. The Fukuoka Green Building in Momochihama, Fukuoka—completed 30 years ago and 100% vacant after its sole tenant left—had previously booked a JPY 4.933 billion impairment and has now been sold for JPY 5.5 billion to an undisclosed Japanese buyer.The price is above the appraisal value of JPY 4.91 billion and the book value of JPY 5.102 billion. Proceeds will be used to repay debt; LTV is expected to fall from 48.6% to 45.7%, and the distribution per unit forecast for the February 2027 period is raised from 1,093 yen to 2,071 yen.The rub: a vacant, older office can clear the private market above appraised value, while the REIT’s own unit price trades below book NAV. Using current-period NAV per unit of JPY 114,099, the September 24 close implies a P/NAV of about 0.92x.Using single-building income property listing data on the Urbalytics platform, we looked at station areas where Sankei RE’s Tokyo offices are located. Median listing cap rates are 3.83% in Hatchobori (n=18), 3.89% in Akasaka (n=12), and 4.13% in Kodemmacho near Nihonbashi-Honcho (n=18).Sankei RE’s TOB price, unit price and NAV, and median cap rates in station areas where it holds propertiesUrbalytics Insight Median listing cap rates in the three central areas are around 4%, below the Fukuoka building’s 4.4% appraisal cap rate. Private-market pricing has not fallen 14% the way the REIT index has.Of course, these samples are mainly small to mid-size single buildings and not fully comparable to the REIT’s institutional-grade offices—better suited to gauging direction. In east Tokyo, Toyocho is 5.01% (n=9, ref only), and Omori in Ota Ward is 5.04% (n=124). Inter-area cap-rate spreads are also evident; see Urbalytics [Chuo Ward single-building income property market report](https://www.urbalytics.jp/market/area/tokyo/chuo-ku/building) for detailed distributions.V. How investors should read this transactionFor remaining unitholders, this is a choice: JPY 125,000 is about 9.6% above current-period NAV, and third-party valuations by Mizuho Securities cap out below the offer price; but it is only 7.95% above the past six-month average, so investors who bought higher during the previous round may be unsatisfied.More important is to understand the bidder’s plan post-control. The notice lists three options: merging with other listed REITs or private funds; selling assets one by one to third parties; and negotiating with Sankei Building’s new owner over the disposition of hotels and other assets.This suggests the REIT’s “portfolio-level discount” could be realized piece by piece at “private-market prices.” For individual investors targeting single-building deals in Tokyo, such piecemeal disposals often bring a wave of institutional-grade supply and push transaction prices for central Tokyo offices and hotels toward more transparent ranges.Risk warning The deal could still shift: a higher counter-TOB or failure of the unit consolidation resolution could delay the delisting timeline; further rate increases could also depress private-market sale prices.In retrospect, this nine-month tug-of-war is fundamentally a pricing question in a rising-rate cycle: the public market has discounted REITs; the private market has not. Who captures the spread should become clear in the coming months.Until then, rather than just watching TOB notices, use Urbalytics’ station-area cap rates and the [Minato Ward single-building income property market report](https://www.urbalytics.jp/market/area/tokyo/minato-ku/building) to benchmark what your assets are worth in the private market.Tokyo Stock Exchange; Sankei RE plans to delist from the TSE REIT market after the offer succeeds#SankeiREIT #FormerMurakamiFund #TenderOffer #TOB #JREIT #REITPrivatization #TokyoOffice #JapanHotelInvestment #NAVDiscount #ConduitRequirements #JapanRealEstateInvestment #TokyoSingleBuilding #CapRates #FujiMedia #UrbalyticsReferencesReuters (via Yahoo! News), “Sankei RE expresses support for TOB by former Murakami fund group”, 2026, https://news.yahoo.co.jp/articles/d11041d5a0cdb319199a4e068148d9b39c1d2289Sankei Real Estate Investment Corporation, “Notice regarding statement of support and neutral opinion on tendering for the tender offer by City Index Fifth Co., Ltd.”, 2026, https://www.s-reit.co.jp/file/news-d7c064fb3ac865a729940e8480530774a5e8122e.pdfSankei Real Estate Investment Corporation, “Notice regarding commencement of tender offer by City Index Fifth Co., Ltd.”, 2026, https://www.s-reit.co.jp/file/news-ce1d222e1508ed7c78361561d57fef0f19efca97.pdfSankei Real Estate Investment Corporation, “Notice regarding revisions to operating results and distribution forecasts for the fiscal periods ending August 2026 and February 2027”, 2026, https://www.s-reit.co.jp/file/news-6a3354103cae2a0221e786cc67adf84d22692040.pdfSankei Real Estate Investment Corporation, “Notice regarding transfer of domestic real estate trust beneficiary interests (Fukuoka Green Building)”, 2026, https://www.s-reit.co.jp/file/news-0aeb3c9fc75e4c1825ee6e1d135df8b8a5448d19.pdfM&A Online, “Sankei Real Estate Investment Corporation (2972) to accept TOB by City Index Fifth and go private”, 2026, https://maonline.jp/news/20260925fNewsweek Japan (Reuters), “Tosei’s TOB for Sankei RE fails as tenders fall short of minimum threshold”, 2026, https://www.newsweekjapan.jp/articles/-/322885?display=bNikkei Real Estate Market Information, “TOB for Sankei REIT fails; listing to continue”, 2026, https://nfm.nikkeibp.co.jp/atcl/news/21/00001/08195/Toyo Keizai Online, “Fuji Media vs the former Murakami group: the real estate tug-of-war continues”, 2026, https://toyokeizai.net/articles/-/933933?display=bUrbalytics Market Report, Chuo Ward, Single-building income properties, 2026, https://www.urbalytics.jp/market/area/tokyo/chuo-ku/buildingUrbalytics Market Report, Minato Ward, Single-building income properties, 2026, https://www.urbalytics.jp/market/area/tokyo/minato-ku/building
Setagaya Leads Views for Two Years, But It Isn’t the Top on Returns

Setagaya Leads Views for Two Years, But It Isn’t the Top on Returns

Among the three most-watched wards in Tokyo’s 23 wards, Setagaya—despite having the lowest rent per square meter—offers a 4.11% gross yield, while Minato, with the highest rents, is only 3.11%.1. A ranking of "how many times it was viewed," and what it actually meansat home released the 2026 edition of its “Buying & Town Ranking: Tokyo 23 Wards” on September 16. Setagaya retained the overall top spot, followed by Minato and then Shinjuku. After media pickup on September 24, the ranking re-entered Chinese-speaking investors’ feeds.Definitions matter up front, or the entire conclusion will be misread. This ranking counts the number of page views (PV) on at home for for-sale residential property detail pages during the survey period of May 1 to July 31, 2026. It measures how many times listings were viewed—not how many units sold, and not price levels.In other words, this is an attention ranking. There is a full decision chain between attention and a buy decision, and each link in that chain can be tested with data.By audience segment, the order actually splits:Singles (ワンルーム~1DK): Shinjuku tops the list. Multiple JR lines, Tokyo Metro, Toei Subway, Odakyu and Keio intersect here; the absolute advantage in commute radius outweighs considerations about the living environment.Couples (1LDK~2DK): Minato ranks first. The high-end residential belt spanning Aoyama, Azabu, Shirokane, and Takanawa, combined with ongoing redevelopment around Toranomon and Shinagawa, underpins a brand premium.Families (2LDK and above): Setagaya remains No. 1, with Nerima close behind—both are among the most populous wards with complete daily-life infrastructure, but sit a bit farther from the urban core.Concept image of low-rise residential streets in western TokyoThe release timing also matters. Data published by Tokyo Kantei on September 24 show that in August, the average asking price of pre-owned condominiums in Tokyo Metropolis (70 m² equivalent) was ¥112.74 million, down 0.2% m/m—the first decline in 28 months; the 23 wards averaged ¥126.77 million, marking a third consecutive monthly drop. Peak attention is arriving just as prices begin to soften.2. Putting the three wards on the same ruler: rent per m² ordering aligns with the rankingRankings alone don’t mean much; you need a yardstick for cross-comparison. Using Urbalytics’ rent_stats, we pulled asking rent data for apartment units at three representative stations—Sangen-jaya (Setagaya), Shinjuku (Shinjuku Ward), and Azabu-Juban (Minato).By median monthly rent per square meter, the order nearly matches the ranking: Sangen-jaya ¥4,467/m²/month, Shinjuku ¥5,412/m²/month, Azabu-Juban ¥5,803/m²/month. Azabu-Juban is roughly 30% higher than Sangen-jaya.But the gap in total monthly rent is much larger than in unit price. Azabu-Juban averages ¥369,700 per month, while Sangen-jaya is only ¥151,300—2.4x lower. The reason is unit mix: Azabu-Juban’s average size is 47.58 m² versus just 32.69 m² in Sangen-jaya.Here’s a common misread worth calling out. To judge whether “rent is expensive,” look at the total; to judge “value for money,” look at rent per m²—Minato’s lead in total rent is half unit price and half larger units.Representative stations of the top-three popular wards in Tokyo’s 23 wards: asking rent per m² and whole-building gross yieldShinjuku is the most distinctive of the three. Its average unit size is only 29.09 m², the smallest among the three stations, yet its per-m² rent nearly matches Minato. With the highest density of singles-oriented stock, its per-m² rent is pushed into the first tier—precisely corroborating why it ranks No. 1 for singles.Urbalytics Insight Urbalytics’ asking-rent data show that the per-m² ordering (Sangen-jaya ¥4,467<Shinjuku ¥5,412<Azabu-Juban ¥5,803) closely matches at home’s PV ranking, indicating this “view count” list does capture real demand segmentation. But the unit-price order doesn’t directly translate into return order—that’s what we unpack next.3. The yield order is the reverseSwitching from rents to the buy side flips the picture. Using building_cap_rate_stats for the same three stations, the median gross yield on whole-building assets is: Sangen-jaya 4.11% (n=135), Shinjuku 4.30% (n=31), and Azabu-Juban only 3.11% (n=34).In other words, Azabu-Juban’s highest per-m² rents deliver the lowest investor returns of the three. High rents didn’t translate into high returns because the denominator rose faster than the numerator: the average asking price for whole-building assets is ¥879 million in Azabu-Juban, ¥731 million in Shinjuku, and ¥427 million in Sangen-jaya.The entry-price gap is the most practical dividing line across these wards. With the same ¥880 million budget, you’ll likely buy one building in Azabu-Juban, but two in Sangen-jaya—and each of the latter comes with a full percentage point higher gross yield.Concept image of hillside streets in central luxury residential districtsEven more notable is the trajectory of price per tsubo. Urbalytics’ quarterly data show that Sangen-jaya’s average whole-building price per tsubo fell from ¥5.7191 million in Q1–Q3 2026 to ¥4.2462 million in Q3 2026, a cumulative 21.93% decline. Azabu-Juban fell from ¥9.4876 million in Q4 2025 to ¥8.1660 million, down 13.93%.Attention is rising while asking prices are falling—both are happening at once. Set beside Tokyo Kantei’s macro “first decline in 28 months,” this isn’t a one-station quirk but a slice of the 23 wards broadly entering a price-digestion phase.Risk disclosures Rents, yields, and price-per-tsubo cited here are based on listing (asking) data, not closed prices; there is typically room for negotiation between ask and close. Gross yield is before management fees, repairs, fixed-asset taxes, and vacancy loss. Shinjuku’s sample is only 31, and one outlier distorted the mean in the raw data; we use medians throughout. Station-level averages also mask wide dispersion within the same station area by build year and walk distance; real decisions must drill down to the individual-building level.4. How different buyers should use this rankingThe takeaway isn’t “Setagaya is better than Minato.” The real point is that these three wards are answering fundamentally different questions; ranking them on the same list invites misinterpretation.For different buyer types, these names mean different things:First, for owner-occupier families prioritizing daily-life radius, Setagaya’s logic holds. With a population of roughly 930,000, multi-line connectivity, and comprehensive education and healthcare, it has topped the family segment two years running, and a 4.11% whole-building gross yield suggests prices haven’t yet been bid to imbalance by end-user demand.Second, for buyers prioritizing asset recognizability and liquidity, Minato’s 3.11% is not a cash-flow purchase but a bet on certainty at exit. The brand equity of the luxury belt, an international tenant pool, and ongoing redevelopment together create assets that are easier to hand off when the market cools—at the cost of accepting roughly a one-third yield discount.Third, for cash-flow-first investors, Shinjuku’s 4.30% median looks most tempting, but the sample is only 31 and concentrated in mixed-use assets around Kabukicho; the asset character differs materially from the other two and shouldn’t be valued as “pure residential.”Concept image of compact residential clusters around a terminal stationAs for what comes next, three straight quarters of price-per-tsubo declines with attention still high usually means buyer and seller price expectations haven’t aligned. After the BOJ lifted the policy rate to 1.25%, financing costs will keep pressure on the denominator in the near term, so these three wards are more likely to keep digesting within the current range than to rebound quickly—an advantageous window for cash-rich, patient buyers.The right move isn’t to chase the leaderboard, but to pull the ward, line, and price band you care about down to station-level granularity and run your own comparisons. On Urbalytics you can compare rents, gross yields, and price-per-tsubo change percentiles by station and ZIP code.※ The concept images in this article are AI-generated and not real photographs.#JapanRealEstate #BuyInTokyo #Tokyo23Wards #Setagaya #Minato #Shinjuku #Sangenjaya #AzabuJuban #GrossYield #RentalYield #WholeBuilding #PreOwnedCondo #TokyoHomePrices #OverseasProperty #UrbalyticsReferencesat home Co., Ltd., “Buying & Town Ranking: Tokyo 23 Wards,” 2026, https://www.athome.co.jp/corporate/news/ranking/town/kounyumachi-ranking-23ku-202609/Otona Answer, “Latest! at home ‘Buying & Town Ranking’ Tokyo 23 Wards edition: No. 3 ‘Shinjuku’… Who are No. 2 & No. 1?” (via Yahoo! News), 2026, https://news.yahoo.co.jp/articles/c61cac6e78868672868f19ec737abd788f2ca7a7Asahi Shimbun, “Tokyo’s pre-owned condo prices ‘fall for the first time in 28 months’: adjustment phase in the city center” (Tokyo Kantei August 2026 data), 2026, https://www.asahi.com/Kyodo News, “Tokyo’s 23 wards fall for 3 straight months: August pre-owned condos,” 2026, https://news.yahoo.co.jp/Kenbiya, “Liquidity decline becomes clear in pre-owned condos across Tokyo’s 23 wards,” 2026, https://www.kenbiya.com/ar/ns/research/price_trends/10533.htmlUrbalytics platform data (rent_stats / building_cap_rate_stats, retrieved September 24, 2026), 2026, https://www.urbalytics.jp/
BOJ hikes to 1.25%: Your mortgage payment won’t change today

BOJ hikes to 1.25%: Your mortgage payment won’t change today

The Bank of Japan has lifted the policy rate to 1.25%, but monthly payments on variable-rate mortgages will not actually move until early 2027 — that roughly half-year lag is your actionable window.At midday on September 18, 2026, the Bank of Japan, at its two-day Monetary Policy Meeting, raised the policy rate from 1.00% to 1.25%. The vote was 7 in favor and 2 against. This is the highest level in roughly 31 years, since 1995.For most people who own property in Japan or are considering a purchase, the real question is not “did rates rise,” but “when and through what path will this 25 basis points show up on my monthly bill.” The answer is more complex — and slower — than you might think.Concept image of a residential street in TokyoWhy this hike came faster than markets expectedTo understand the weight of this decision, look at the cadence first. After exiting negative rates in March 2024, the BOJ had been hiking roughly “once every half year.” This time, only three months have passed since the June 2026 meeting — the shortest hiking interval since the exit from negative rates.The reason for the sudden acceleration is broadly consistent across media: higher crude prices, combined with a weaker yen, have raised the risk of upside inflation. The BOJ chose to move early rather than wait to repair the damage after the inflation data fully deteriorate.Note the split vote. It was 7–2, with the two dissents coming from Policy Board members appointed by Prime Minister Takaichi. This suggests the political cost of further hikes is rising, and each subsequent decision could be tougher than this one.After the announcement, the yen briefly traded in the high ¥156 per USD. In other words, markets did not read this as a “stronger yen ahead” signal, but as the BOJ merely catching up. For buyers using foreign-currency assets to acquire Japanese properties, the FX leg remains unsteady.Three gates stand between the policy rate and your billThis is the part most often misread. A higher policy rate does not mean your mortgage rate adjusts that same day — there are at least three independent dates in between.According to CPA Taro Sennichi’s summary in Diamond Real Estate Research Institute, the three gates are:First, the day each bank changes its “base rate.” Banks set this on their own schedules — some monthly, some semiannually — and they do not move in sync.Second, the day your individual “borrowed rate” under contract is reviewed. Even within the same bank, new loans and existing loans often follow different timetables.Third, the day the changed rate actually flows through to your repayment amount. This one is the slowest and most likely to create the illusion of “no impact.”The result of these three gates is that full alignment across banks takes about half a year. At banks with two rate reviews per year, if you miss the review date, the reflection may be delayed until as late as April–May 2027. As for the June 2026 hike (to 1.00%), by the same estimate it will actually affect repayment amounts around January 2027.Concept image of a bank counterRisk note What’s even easier to misunderstand is the “five-year rule.” Under equal principal-and-interest amortization, even if rates rise, your monthly installment is frozen for five years; in the sixth year it is recalculated, capped at 1.25 times the original amount. But what’s frozen is the bill amount, not the debt itself — the interest share rises and principal amortization slows. An unchanged payment does not mean a hike hasn’t affected you. Also note: PayPay Bank, Sony Bank, and SBI Shinsei Bank do not apply the five-year rule.Once rates align, league tables will flipThe rate tables you see today are really a blended snapshot with uneven pass-through. Some banks have already incorporated the previous hike; others have not. Side-by-side comparisons are of limited use.As of September 2026, applicable rates show Resona Bank at 0.950% (lowest), SBI Shinsei Bank at 1.080%, and MUFG Bank at 1.195%. But SBI Shinsei has already announced it will raise the base rate on variable loans by 0.35 percentage points from October 1, which is not reflected in September’s figures.If you fully reflect the impact of a 1.25% policy rate (assuming no extra markup beyond the BOJ hike and no change in discount margins), the same estimate reorders the list to: MUFG 1.445%, Resona 1.450%, swapping their positions; PayPay Bank 1.580%; and docomo SMTB Net Bank 1.750%.The gaps are small — too small to be the sole basis for choice. What you should evaluate alongside are group credit life insurance coverage, processing fees, and the actual discount terms the bank offers you at underwriting — the headline rate is the starting line, not the finish.The fixed-rate side is moving much faster. In September 2026, Flat 35 (loan term 21+ years, 10%+ down payment, with credit life) stood at 3.460%. Based on the Japan Housing Finance Agency’s 233rd JHF bond issued on September 16 with a coupon of 3.650%, October’s Flat 35 is projected to rise to 3.640%. Over the same period, the 10-year JGB yield hovered around 2.996%.Urbalytics Insight Shift the lens from owner-occupied homes to income properties and the picture clarifies. Urbalytics data show median gross yields for whole-building assets within major Tokyo station areas at roughly 4.27% in Shinjuku, 4.70% in Ikebukuro, 5.10% in Kamata, and 5.50% in Kitasenju. Over the same period, per-tsubo prices rose about 17% in Ikebukuro and about 25% in Kitasenju over the past year, while Kamata has trended lower since Q3 2025. In short, yields have been broadly flat; it’s the cost of capital that’s moving.Gross yield vs. funding cost for a whole-building income propertyWhat this hike means for different peopleThe same 25 basis points mean very different things depending on your holding structure.For owner-occupiers already on variable rates, your bill will likely stay put in the short term, but your debt mix is quietly shifting. The practical task is not to panic-switch to fixed, but to calculate two numbers: your monthly payment once the 1.25% policy rate is fully passed through, and your payment if the policy rate reaches 2.0%. You can get the latter by adding 0.75 percentage points to the 1.25% scenario.For those weighing variable versus fixed, the problem is often framed the wrong way. Using MUFG Bank’s September 1, 2026 figures as an example, the spread between variable at 1.195% and 10-year fixed at 3.63% is 243.5 basis points. Choosing variable is effectively a bet that the average rate over the next decade will not exceed today’s by more than 2.4 percentage points — the question isn’t “will it rise,” but “will it rise that much.”The Japan Housing Finance Agency’s user survey (January 2026; 1,237 loans originated April–September 2025) shows 75.0% chose variable, while 73.7% expect rates to rise over the next year. Seen together this looks contradictory, but against a 243.5 bps pricing gap, it is a defensible choice.For investors holding income properties, pressure comes from both sides. Rents adjust far more slowly than interest rates — on Urbalytics, rental mansions in Ikebukuro (Q3 2026; n=496) show a median unit rent of about 0.450万円/㎡ (≈¥4,500/m²) and an average monthly rent of ¥158,500. Those numbers will not be repriced by a single hike. The rise in funding cost is immediate, and the squeezed spread comes out of owners’ cash flow first.Concept image of the Tokyo skylineWhat to track over the next six monthsIn the near term, the most important things to watch are not the policy rate itself, but each bank’s moves on the “base rate” and on “discount margins.” They work very differently:A higher base rate hits both existing borrowers and new borrowers.Narrower discounts affect only new signings; existing contracts are not impacted.For example, in the same estimate, between March 2024 and the scenario with a 1.25% policy rate, docomo SMTB Net Bank’s base rate rose by 125 bps, while its applicable rate rose by 170.2 bps — the 45.2 bps difference reflects tighter discounts. Conversely, AEON Bank’s base rate rose by 135 bps, while the applicable rate rose by only 119 bps, indicating it is widening new-customer discounts to gain share.As for the next hike, market views are not yet converged. In Bloomberg’s survey, 58% expect January 2027 and 35% expect December 2026. Either way, the probability of another move within six months is not low.For those planning to act within this window, a pragmatic approach is to treat “today’s rates” as reference, use “post-alignment rates” as your budgeting base case, and back into affordable prices using actual gross yields and rent levels on income properties. Urbalytics’ area-level yield and rent data are built for exactly this reverse-engineering step.#JapanRealEstate #JapanRateHike #BankOfJapan #PolicyRate #HomeLoans #VariableRate #FixedRate #Flat35 #TokyoProperty #IncomeProperty #GrossYield #WholeBuilding #TokyoInvestment #MortgageRates #Urbalytics※ The images in this article are AI-generated conceptual images, not real photographs.References日本銀行「金融政策決定会合」2026年9月18日決定 — https://www.boj.or.jp/mopo/mpmdeci/index.htm時事通信「日銀、1.25%に利上げ=決定会合、物価高でペース加速」2026年9月18日 — https://www.jiji.com/Bloomberg「日銀が政策金利1.25%に引き上げ決定、賛成7・反対2-ペース加速」2026年9月18日 — https://www.bloomberg.co.jp/共同通信「日銀利上げ、1.25%に ペース最短3カ月に加速」2026年9月18日 — https://nordot.app/ダイヤモンド不動産研究所「日銀の追加利上げ+0.25%で住宅ローン変動金利はどうなる? 12銀行の金利動向から本当にお得な金利を試算!」2026年9月18日 — https://diamond.jp/articles/-/realestateダイヤモンド不動産研究所「10月のフラット35金利はさらに上昇で3.5%超えか?! 住宅ローン金利(変動・10年固定)を予想!」2026年9月18日 — https://diamond.jp/articles/-/realestate住宅金融支援機構「フラット35 金利情報」2026年9月 — https://www.flat35.com/住宅金融支援機構「住宅ローン利用者の実態調査」2026年2月20日公表 — https://www.jhf.go.jp/三菱UFJ銀行「住宅ローン金利」2026年9月1日現在 — https://www.bk.mufg.jp/kariru/jutaku/財務省「国債金利情報」2026年9月 — https://www.mof.go.jp/jgbs/reference/interest_rate/Urbalytics 掲載データ(一棟収益物件の表面利回り・坪単価・賃料統計、2026年9月18日取得) — https://www.urbalytics.jp/
Greater Tokyo new‑condo average slips to ¥97.70 million: a ‘no high‑end launches’ statistical mirage

Greater Tokyo new‑condo average slips to ¥97.70 million: a ‘no high‑end launches’ statistical mirage

Greater Tokyo’s average fell below ¥100 million for the first time in four months; what declined wasn’t prices, but the supply of high‑priced central‑city product.If you only read the headline, August 2026’s Greater Tokyo new‑condo market seems to have finally loosened: data released by the Real Estate Economic Institute on Sept 17 show the average price of newly built for‑sale condominiums across Tokyo and the three surrounding prefectures at ¥97.70 million, down 5.4% YoY—the first print below ¥100 million in four months.For buyers who have waited three years for a “turning point,” that figure is enough to quicken the pulse. But turn one page in the same report, and the conclusion flips.In the same dataset, none of the four areas actually fellThe counterintuitive part is this: of the four regions that make up the “decline,” not one actually declined.Tokyo’s 23 wards averaged ¥138.21 million in August, up 0.1% YoY, marking 16 straight months above ¥100 million. Kanagawa came in at ¥73.09 million (+10.6% YoY); Saitama ¥68.40 million (+15.6%); Chiba ¥67.02 million (+9.1%).All four rose, yet the combined average fell 5.4%—not an arithmetic error, but a change in weighting. As high‑ticket central projects largely disappeared from the denominator, the remaining samples pulled the average down.Supply data make this explicit: Kanagawa launched 140 units in August (−37.8% YoY); the Tokyo 23 wards just 478 units (−30.7% YoY). By contrast, Chiba reached 247 units on large launches around Funabashi, nearly doubling YoY (+100.8%).August 2026 Greater Tokyo new condos: average price and supply mixIn short, August was a month of “no expensive launches, concentrated cheaper launches.” The supposed drop in the average is a statistical mirage, not a price concession.Land and build costs are pushing developers out of the coreWhy did supply buckle? The answer is on the cost side.At the press briefing, REEI senior chief researcher Tadashi Matsuda noted that rising construction costs are redrawing project feasibility boundaries: the farther out you go, the harder it is to price to local market levels.That point is worth dwelling on. It shows developers face not a demand question—“will it sell?”—but a supply question: “can we secure land, and do the numbers pencil?” MLIT’s benchmark land prices released Sept 15 show nationwide land up for five straight years, commercial land +2.9%, led by Tokyo and Osaka—no sign of relief on the land‑cost side.The result is a pincer squeeze: in the core, land is too costly to start projects; in the suburbs, local rents and incomes cap achievable pricing below what construction costs require. The thick middle of the product spectrum is being thinned from both ends.Urbalytics Insight From Urbalytics’ internal data, Funabashi is not simply “cheap.” Within the Funabashi Station catchment, 486 rental‑apartment samples show advertised rent per tsubo has recovered from 0.97 ×10,000 yen (≈¥9,700) in 2025 Q4 to 1.00 ×10,000 yen (¥10,000) in 2026 Q3, while sample size in the same period expanded from 15 to 219—volume and price strengthened together, indicating genuine spillover of end‑user demand rather than pure discounting.Around Funabashi Station — Chiba’s gateway absorbing core‑city spillover demandWhole‑building income side: Funabashi’s prices have already moved firstThe new‑condo average is only one side of the story. For income‑oriented investors, what’s happening to whole‑building assets in the same area is more informative.On the Urbalytics platform, 105 whole‑building listings within the Funabashi Station area show an average gross yield (hyomen rimawari) of 6.36% (median 6.00%), an average asking price around ¥170.28 million, and annual income of about ¥10.10 million. In the commuter belt across the Tokyo metro, that yield level is upper‑mid.But the price trajectory hasn’t been smooth. Achieved price per tsubo surged from ¥1.76 million in 2025 Q3 to ¥2.78 million in 2026 Q1, then eased to ¥1.8265 million in Q3—only +3.75% net over the whole period.Funabashi area: five‑quarter trend of rents and whole‑building pricesThis curve suggests Funabashi pricing tested higher and then reverted ahead of new‑condo supply. The early‑year peak looks like a seller‑sentiment spike, while today’s ~¥1.8 million/tsubo zone is where buyers and sellers are shaking hands again.Risk disclosure An average decline does not equal wider negotiation room. When supply is intentionally curtailed, buyers’ bargaining power tends to shrink, not expand. Also note: Funabashi’s 2025 Q3 rent sample count was just 2, so it is indicative only and not a reliable trend anchor.Three practical takeaways for investorsIn sum, the August data imply three points:First, any “Greater Tokyo average” during a month of volatile supply cannot be read directly as a price signal; check the month’s regional mix and unit counts before deciding whether the number is usable.Second, the core and the periphery are formalizing a role split—the 23 wards maintain scarcity pricing above ¥100 million, while Kanagawa, Saitama, and Chiba absorb end‑user demand priced out of the core. This spillover chain expands the investable set for both whole‑building and unit investors.Third, cost‑push high price points won’t fall simply because demand softens; the variables most likely to trigger price adjustment are interest rates and financing conditions, not noise in a monthly average.On Sept 17 the Bank of Japan hiked rates; Tokyo real estate stocks nevertheless rose broadly that day, with over 80% of TSE Prime constituents closing higher—the market’s read on “rate normalization” is clearly cooler than a single monthly average.Conclusion: When you read data, read the denominator firstThis August 2026 headline is a textbook demonstration of a statistical trap. The ¥97.70 million figure itself isn’t wrong; what’s wrong is taking it as evidence of price weakness.In a market where supply is constrained by costs and demand is spreading outward, genuinely useful judgments rest on finer‑grained data—rent per tsubo by station area, yield distributions by asset type, and quarter‑to‑quarter changes in sample size. That is precisely what Urbalytics focuses on: translating coarse “Greater Tokyo” narratives into local, actionable values.#GreaterTokyoHousing #NewCondos #Tokyo23Wards #FunabashiChiba #KanagawaRealEstate #SaitamaRealEstate #JapanPropertyInvestment #WholeBuildingIncomeAssets #GrossYield #RealEstateEconomicInstitute #BenchmarkLandPrices #BOJRateHike #RentalMarket #SupplyContraction #UrbalyticsReferences1. The Yomiuri Shimbun, 2026, “In August, Greater Tokyo’s new‑build condos averaged ¥97.70 million, down 5.4% YoY, as supply declined in the high‑price segment”, https://www.yomiuri.co.jp/economy/20260917-GYT1T00335/2. Asahi Shimbun, 2026, “Greater Tokyo new‑build condos at ¥97.70 million in August—first sub‑¥100 million in four months”, https://news.yahoo.co.jp/articles/57afd1497a0211dfff99c000443a921409d4671d3. TBS NEWS DIG, 2026, “August new‑build condo prices: Greater Tokyo ¥97.70 million, below ¥100 million for the first time in four months”, https://news.yahoo.co.jp/articles/dfa135ae546127d3b4575720a5dd14186589b29b4. Kenbiya, 2026, “MLIT releases benchmark land prices. Nationwide land up five consecutive years. Commercial +2.9%, led by Tokyo and Osaka”, https://www.kenbiya.com/ar/ns/research/5. The Yomiuri Shimbun, 2026, “Nikkei 225 closes up ¥213”, https://www.yomiuri.co.jp/economy/20260917-GYT1T00274/6. Urbalytics internal platform data (Funabashi Station area: rental apartments 486 cases / whole‑building income 105 cases, retrieved Sept 17, 2026), https://www.urbalytics.jp
Setagaya-Daita: From 177th to 6th—A value re-rating of a local-only Tokyo station

Setagaya-Daita: From 177th to 6th—A value re-rating of a local-only Tokyo station

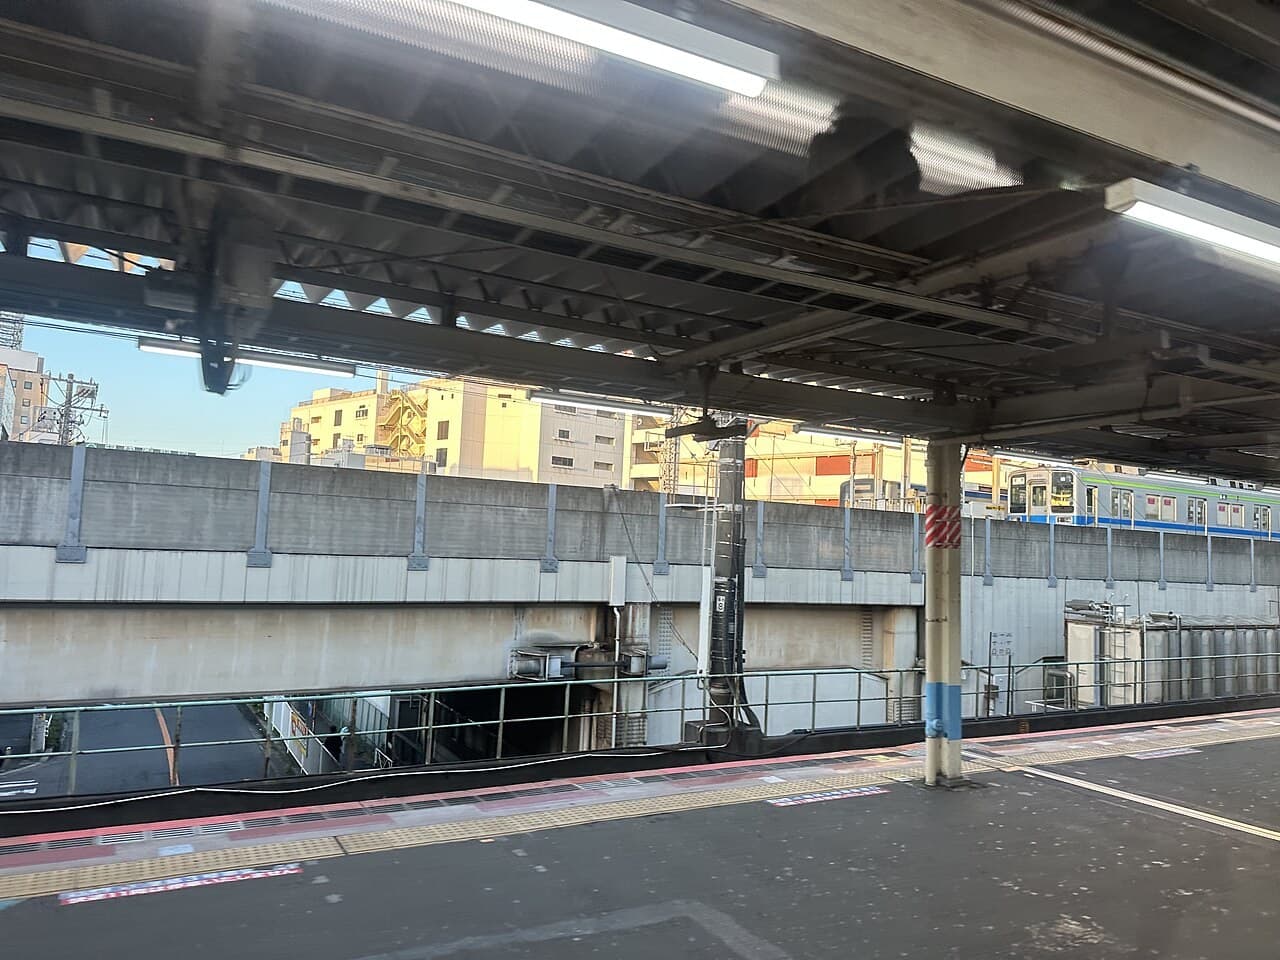
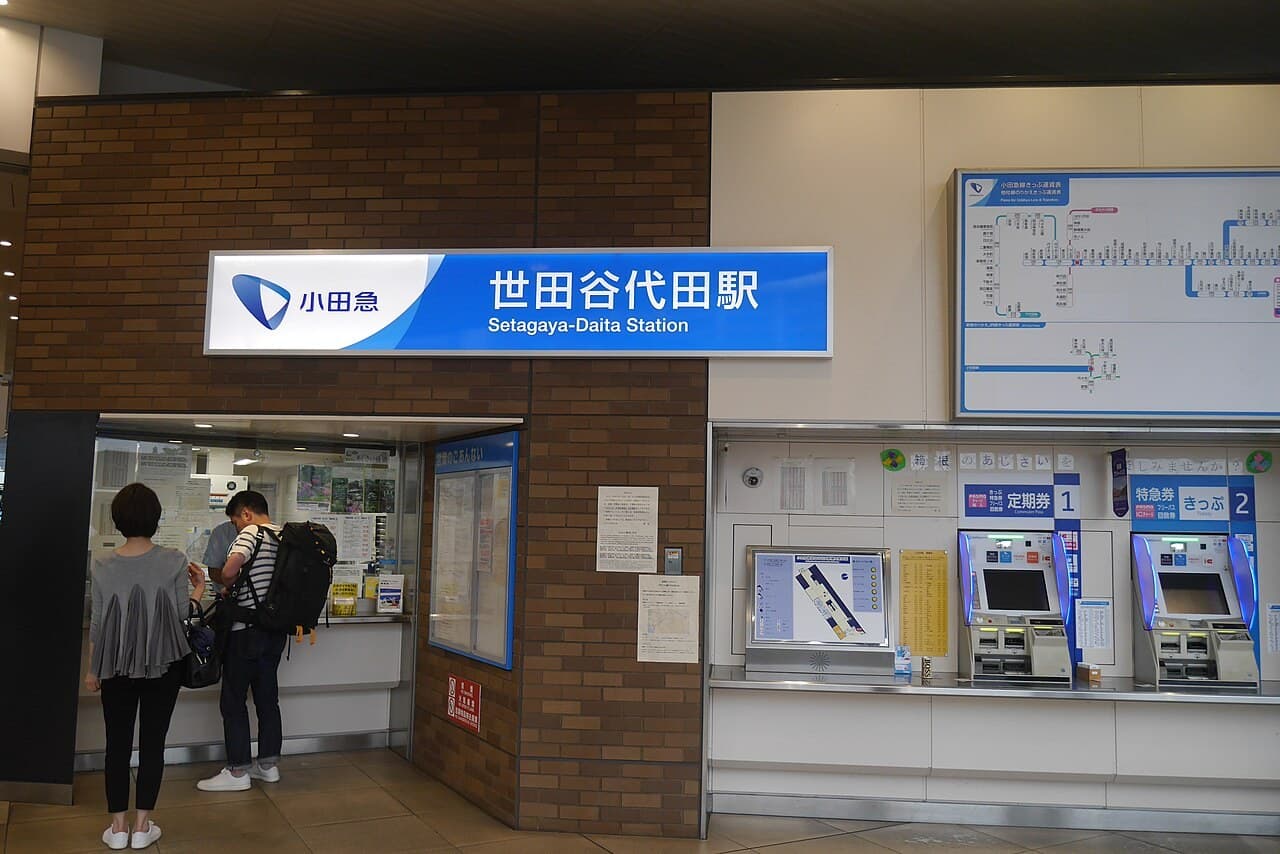
A local-only station with fewer than 10,000 daily passengers has surged to No. 6 in the Greater Tokyo rankings, yet per-tsubo rents have already caught up with Shimokitazawa while whole-building gross yields have been squeezed to just over 4%.1. The small station that was passed by for four centuriesOn September 1, 2026, SUUMO Research Center under Recruit released the SUUMO Livability Rankings 2026 (Greater Tokyo). Setagaya-Daita Station on the Odakyu Odawara Line (Setagaya City, Tokyo) jumped to 6th overall in the metropolitan area. In the previous 2024 survey it was 177th—an ascent of 171 places in two years.The sample size is far from small: 251,356 valid responses, covering 1,043 stations with 30 or more respondents each. Setagaya-Daita scored an average of 85.16 with a deviation score of 72.03, ranking 5th within Tokyo Metropolis, just behind the Sendagaya and Akasaka tier.Its standing within the ward is even more telling. This time Setagaya-Daita outranked Shimokitazawa (90th) and Sangenjaya (141st) to become No. 1 in Setagaya Ward. For anyone familiar with Tokyo, that feels counterintuitive—Shimokitazawa is one of Japan’s best-known subculture districts, and Sangenjaya has long dominated the “streets you want to live in” lists.Setagaya-Daita’s roots run deep. After the Odawara Campaign ended in 1590, a group known as the “Daita Seven” returned to farm and opened Enjō-in Temple and Daita Hachimangū. The name “Daita” itself comes from the Daidarabocchi giant legend about footprints forming hollows; folklorist Yanagita Kunio examined it in his 1927 work “Daidara-bō no Ashiato.”Yet in the railway era, this station—just 5.6 km from Shinjuku—was long served only by local trains, a quintessential node that was “passed by.” Its turnaround began precisely when the railway ceded the surface.Exterior of Setagaya-Daita Station2. Rents have caught up with Shimokitazawa, but yields are heading lowerRankings capture “want to live,” while investors must ask how much of that desire is already priced in. That is where internal data can answer.Urbalytics data show 91 rental apartment (賃貸マンション) samples around Setagaya-Daita, with an average monthly rent of ¥156,400 on an average 36.60 m². The average per-tsubo rent reached ¥14,200 in 2026 Q3. From 2025 Q4, that curve has cumulatively risen 39.22%.The real signal lies in the control group. Over the same period, 356 samples around Shimokitazawa saw average per-tsubo rent slip from ¥14,900 in 2025 Q4 to ¥14,200 in 2026 Q3, a 4.70% decline. In other words, the two stations’ per-tsubo rents converged in 2026 Q3—one catching up, the other easing.Urbalytics Insight The value of Urbalytics’ internal data is that it captures actual listings and transactions rather than survey “desire.” With only 91 samples at Setagaya-Daita—and just n=2 in 2025 Q4 as a reference—the series is volatile; but the fact it converged in the same quarter to the same per-tsubo level as Shimokitazawa’s 356-sample dataset makes that crossover point more informative than any single-station growth figure.The whole-building income side is much cooler. Eleven samples in the station area show an average gross cap rate (表面利回り) of 4.56% with a median of just 4.19%, ranging from 3.15% to 8.00%. The average closing price is ¥271.38 million, for average annual income of ¥11.54 million. Over the same window, whole-building per-tsubo prices rose from ¥3.1434 million to ¥3.4462 million, a cumulative +9.63%.Overlaying the two sets of numbers yields a clear conclusion: rent growth is lagging asset-price growth. Livability premia first get capitalized into land and sale prices, then seep into rents. Official land data corroborate this—2025 posted prices for residential land around Daita were already in the ¥797,000–¥887,000 per m² range.Per-tsubo rent comparison: Setagaya-Daita vs. Shimokitazawa, and whole-building per-tsubo price trend3. Burying the railway to unlock 27,500 m²The transformation stems from the continuous grade separation and quadruple-tracking project (連続立体交差化・複々線化事業) between Yoyogi-Uehara and Noborito. Launched in 1994, the Higashi-Kitazawa–Setagaya-Daita segment was initially planned as elevated, but was switched to underground due to structural constraints at the Shimokitazawa crossing with the Keio Inokashira Line, high land-acquisition costs along the Shimokitazawa shopping street, and resident demands for a station plaza.Milestones were hard won. Work on the segment started in 2004; a temporary bridge station opened in 2006. In 2013, together with Higashi-Kitazawa and Shimokitazawa, it moved underground, with all nine level crossings removed. Immediately after, a temporary platform was even needed on the express line on the third basement level, forcing passengers to climb 106 temporary steps.The ticket gates returned to the surface in 2015; the surface station building was completed in 2017. In March 2018, the local (slow) line platform on the second basement level opened, completing quadruple-tracking; through-services to the Chiyoda Line began stopping here. The overall project wrapped in 2019. Capacity effects were immediate: peak-hour congestion on the most crowded section (Setagaya-Daita → Shimokitazawa) fell from 192%–194% in FY2016–2017 to 151%.The true upside is on the surface. Roughly 1.7 km and about 27,500 m² of former right-of-way between Yoyogi-Uehara and Setagaya-Daita was converted into “Shimokita Line Street,” fully opened in 2022: the pedestrian retail street BONUS TRACK, the ryokan “Yuen Bettei Daita” drawing Hakone hot-spring water, coworking spaces, and the Tokyo University of Agriculture Open College line the corridor.The ranking criteria shifted accordingly. Setagaya-Daita’s highest scores were not for transport but for “developing an attachment to the character of the neighborhood” (deviation 65.74), followed by “attractive library facilities” (65.08), “a sense that living here adds value to life” (64.41), and “facilities for quiet work” (64.37). Transport (64.35) ranked only fifth.Open spaces along Shimokita Line Street4. How did a 9,582-passenger small station place 6th?In FY2024, Setagaya-Daita handled a daily average of 9,582 entries/exits, ranking 63rd of 70 stations on the Odakyu network. There is an obvious gap between station scale and a No. 6 metropolitan ranking.That gap is precisely the part most valuable for investment judgment: footfall is no longer a single proxy for area quality. Modest flows avoid mega-hub congestion and over-commercialization, allowing “slow infrastructure” such as low-rise storefronts, libraries, and coworking spaces to take root.The same pattern repeats along the Odakyu. In this ranking, Sangubashi (5th), Higashi-Kitazawa (27th), and Yoyogi-Uehara (29th) are all primarily local stops with generous pedestrian realms. Staying (滞在性) is displacing throughput (通過性) as a new source of value along the line.Cultural layering adds resilience. The 2022 TV drama “silent” used the Setagaya-Daita station plaza and nearby cafés as main locations. In the broadcast month (November), non-commuter ridership at the station rose 22.7% versus September. Odakyu later distributed filming-location maps network-wide. A neighborhood of about 23,000 people thus entered the national conversation.With Urbalytics’ area-comparison tools, investors can decompose this kind of “narrative-driven appreciation” back into verifiable quantities: whether per-tsubo rents are keeping pace, where whole-building cap rates are being compressed to, and which per-tsubo price percentiles nearby comps occupy.Setagaya-Daita Station platformConclusion: Livability is not the same as yieldSetagaya-Daita’s leap is a model of public–private collaboration: Odakyu ceded surface space; the Tokyo Metropolitan Government and Setagaya Ward delivered supporting works; history and culture then grew organically. For urban planners, it shows that trillion-yen-grade grade-separation projects pay off beyond shaving minutes off commutes.For investors, weigh both opportunity and risk:First, the opportunity lies in structural scarcity. Few stations can repurpose former right-of-way; undergrounding demands massive capital and more than two decades. This kind of “surface-space dividend” cannot be replicated easily and thus offers a durable moat.Second, the risk is that prices have already moved. A median whole-building cap rate of just 4.19% implies the livability narrative is well priced; meanwhile, rent-side upside still contains small-sample noise, with the 2025 Q4 n=2 datapoint especially unfit to read as a trend.Third, the risk also lies in the durability of the rating itself. Even the source acknowledges it is unclear whether this jump is a one-off media effect or the result of surface space embedding into daily life. If it is the former, rents will be the first to feel pressure as heat fades.Risk warning Infrastructure upgrades and commercial clustering can raise rents and crowd out original residents (gentrification). Setagaya-Daita currently balances new and old with a low-rise, chain-free retail mix and historic sites such as Daita Hachimangū, but this balance is not institutionally guaranteed. If commercialization accelerates, “quietness” as a core selling point may be eroded by its own success.For cross-border investors, the right approach is not to chase rankings, but to treat them as demand-side leading indicators and then use transaction and rent data to infer whether prices are already overextended. To verify a station area’s per-tsubo rent and whole-building cap-rate percentiles, Urbalytics can pull the sample details directly.#SetagayaDaita #Shimokitazawa #SetagayaCity #OdakyuLine #TokyoRealEstate #住み続けたい街ランキング #ShimokitaLineStreet #QuadrupleTracking #WholeBuildingIncome #GrossYield #TokyoRentalMarket #JapanRealEstateInvestment #AreaAnalysis #Urbalytics #Tokyo23WardsReferencesMerkmal(小西マリア),「なぜ「小田急線の各駅停車駅」が171ランクも爆上がりして6位になったのか?「住み続けたい」と評価された世田谷エリアの正体」, September 12, 2026, https://news.yahoo.co.jp/articles/19d3e845062dac58e04b67270e18cfc091588edeRecruit SUUMO Research Center,「SUUMO住み続けたい街ランキング2026 首都圏版」, September 1, 2026, https://www.recruit.co.jp/newsroom/Odakyu Electric Railway,「代々木上原〜登戸間 連続立体交差事業・複々線化事業」, https://www.odakyu.jp/Setagaya City,「下北沢駅周辺地区まちづくり」, https://www.city.setagaya.lg.jp/Ministry of Land, Infrastructure, Transport and Tourism (MLIT),「地価公示(2025年)」, https://www.land.mlit.go.jp/landPrice/Urbalytics internal platform data (rental apartment rent statistics; whole-building cap-rate statistics), September 2026, https://www.urbalytics.jp/
Half earn over JPY 15 million annually yet still can’t buy the average building: the real threshold in Tokyo’s 5 central wards

Half earn over JPY 15 million annually yet still can’t buy the average building: the real threshold in Tokyo’s 5 central wards

The buyer profile in the 5 central wards has moved up across the board, but the average inquiry price of JPY 344 million is still less than half of the actual average listing price.1. With 10-year JGBs at 2.4%, "central Tokyo" is being repricedTo understand the price of central Tokyo assets, first identify the reference asset. According to Jiji Press, the Ministry of Finance set the coupon on the April issuance of 10-year JGBs at 2.4%, the highest in 28 years and 8 months. This matters because it sets the opportunity-cost floor for all income-producing real estate.In other words, with the risk-free rate at 2.4%, a core-city building delivering only a 3% headline gross yield (gross cap rate) offers investors less than one percentage point of risk premium. This isn’t about “cheap” or “expensive”; the pricing logic has shifted from cash-flow harvesting to capital preservation.For cross-border investors, recalibrate your frame of reference. In China’s Tier-1 cities, office/retail cash yields are thin and realization depends on appreciation; in central Tokyo, low yields are not a product of excess liquidity but of being back-solved from a 2.4% long-bond rate—firmer support and less upside elasticity.Meanwhile, demand has not retreated. On September 4, Meiji Yasuda Life announced at the completion ceremony of its new Shinjuku building that it would double its investment real estate balance from roughly JPY 950 billion to about JPY 2 trillion by 2040, citing “rents are rising.” When long-duration domestic capital like life insurers overtly doubles down, the yield ceiling on core assets is pressed from above.Such capital ignores short-term price moves and focuses on the long-run rent curve; once in, it rarely sells. This means the float will thin further in core station areas, leaving individual investors to compete mainly for what remains after institutional screening.Chiyoda Ward office district2. What does JPY 344 million actually buy?A September 4 survey by Kenbiya breaks down inquiry user profiles over the past year (Aug 2025–Jul 2026) across the 5 central wards (Chiyoda, Chuo, Minato, Shinjuku, Shibuya). The conclusion is straightforward: the buyer base has shifted up a notch.Among those inquiring about properties in the 5 central wards, 48.8% report annual income above JPY 15 million, versus 27.8% nationwide; above JPY 20 million, it is 35.4% versus 16.6% nationwide. Company employees remain the largest cohort (about half), but executives rise from 16.2% nationwide to 21.3% in central Tokyo, and doctors/lawyers/accountants from 3.1% to 5.1%.Notably, the occupational mix has barely changed; what shifted is the income quantile within each occupation. In other words, the 5 central wards have not become a “professional buyer market.” It remains the battleground of high-salaried employees—just the leading edge of that group.The true divergence is inquiry price. For company employees, the average inquiry price in the 5 central wards is JPY 344 million, 5.9x the national average for the same occupation; for professional real estate operators it is the highest at JPY 624 million (6.9x nationwide); the most dramatic is the self-employed, from JPY 49 million nationwide to JPY 354 million centrally, a 7.3x jump.Conversely, doctors/lawyers/accountants average about JPY 180 million—the lowest among major occupations and only 2.0x the national figure. They are effectively looking at the same product tier centrally and peripherally, indicating a portfolio-allocation approach rather than leveraged operation.Here is the rub: these numbers, while large, are not high relative to live listings.Urbalytics Insight Internal Urbalytics data show that in the Shinjuku station area, 31 whole-building (commercial) listings average JPY 731 million with a median headline gross yield of 4.27%; in Shibuya, 55 listings average JPY 846 million with a median of 3.40%. The JPY 344 million average inquiry price for company employees only reaches about half the actual average asking price.Central 5 wards whole-building market: rents, yields, pricesThis gap states the obvious: for most high-income individual investors, the so‑called central whole-building market is still one you largely view from the doorway. To actually close, you will need a compromise list in addition to your price budget.3. Shinjuku, Shibuya, Tokyo Station: three pricings within the same "core"Treating the 5 central wards as one is the easiest but also the riskiest analytical shortcut. In Urbalytics’ station-area data, three representative hubs tell different stories.Shinjuku’s median headline gross yield is 4.27% (31 samples; average price JPY 731 million; average annual rent about JPY 34.21 million). This is the highest yield among the three, implying the market demands a higher required return for Shinjuku assets—samples around Kabukicho run 6% to 7.8%, at the cost of 1960s–1980s vintages.Shibuya’s median yield drops to 3.40%, yet the sample count is nearly double Shinjuku’s (55), and the average price is JPY 846 million. Lower yields, more samples, and higher unit prices together typically mean capital is prioritizing this submarket, not that it is deteriorating.Shibuya is also the most split internally. Some Dogenzaka samples exceed 10% headline yield, while more residential-feel areas like Sarugakucho and Shoto sit around 4.5%. Under a single station name, two distinct markets—commercial arteries and residential streets—share one label.The Tokyo Station area has only three samples (too few; indicative only), with a median yield of 2.65%. That level is already close to the 2.4% JGB rate, compressing risk premium to around 0.25 percentage point—more like a long-duration bond in physical form than a conventional income investment.Nishi-Shinjuku high-rise office cluster4. Demand bifurcation: why high earners shift from "units" to "whole buildings"Kenbiya’s survey adds a more actionable clue: as income bands move up, asset category choice shifts structurally.Among company employees around the JPY 10 million band, 64.2% inquire about condominium units; among doctors/lawyers/accountants, 55.2%. Above JPY 50 million income, whole-building assets—commercial and entire residential—rise to around 80%, with units typically dropping to roughly 10%.The underlying reason is straightforward: the issue with units is not yield, but scale ceilings and financing efficiency. A high-end central unit often costs over JPY 100 million but delivers limited rent cash flow; land rights are diluted, and banks rate them below whole-building collateral.Above JPY 50 million income, preferences split into two camps:First, company employees (56.9%), self-employed (55.5%), and professional real estate operators (64.8%) mainly choose whole-building commercial assets, pursuing rent elasticity and re-rating potential from commercial leases, with greater vacancy and capex volatility as the trade-off.Second, corporate executives (39.2%) and doctors/lawyers/accountants (52.9%) favor entire residential buildings; residential leases offer steadier cash flow and lighter management—suited to busy professionals treating property as allocation rather than an operating endeavor.Professional real estate operators are the most consistent: from 45.5% at the JPY 10 million band to 64.8% above JPY 50 million, concentration in whole-building assets keeps rising. The more one earns a living in the sector, the less one diversifies—an implicit vote for commercial buildings as an asset class.One more detail: even above the JPY 50 million band, the self-employed (25.5%) and corporate executives (22.9%) still retain 20%+ inquiries in units, with average ticket sizes around JPY 97 million and JPY 152 million respectively—high-priced units in the core have not been fully abandoned by large checks.Shibuya station-area streetscape5. Outlook and investment takeawaysViewed together, the central 5 wards’ H2 2026 setup is clearer. On the capital side, long-duration money such as life insurers intends to double allocations, capping the yield ceiling on core assets. On rates, the 2.4% long bond pushes from below, thinning safety margins on low-yield assets. The result is prices that rise more easily than they fall, with almost no room for yield improvement.For individual investors, the anchor to reset is expectations. JPY 344 million is a large ticket nationwide but only half the average in core station areas. To enter this market, either build compromises on vintage, micro-location, or scale into your model in advance, or look to station areas still yielding above 4%.From this angle, the 0.87 percentage point gap between Shinjuku’s 4.27% and Shibuya’s 3.40% is a pricing sheet: it marks how much yield the market is willing to give up for “better location and newer stock.” Deciding which side you belong on is far more useful than arguing whether the core is cheap or expensive.Risk notice A reminder on rents: Urbalytics whole-building/office leasing data show median rent around JPY 8,650 per m² in Shinjuku and JPY 10,390 per m² in Shibuya, but Shinjuku’s tsubo asking trend over the past four quarters is -15.4% (only 16 samples; indicative). With yields already compressed to the 3%–4% band, if rents do soften, price cushions will be very thin. Also, a non-trivial share of samples are from the 1960s–1980s; plan for capex and seismic costs up front.The bottom line: the central 5 wards are not a market you can summarize as “cheap” or “expensive”; they stratify buyers automatically by capital size. The real question is not whether to buy the core, but which tier your capital fits and whether that tier’s pricing is reasonable now. To see yield distributions, rent levels, and live listing samples by station area before you place a bid, run a comparison on Urbalytics.#TokyoCentralFiveWards #Shinjuku #Shibuya #Chiyoda #Minato #WholeBuilding #GrossYield #JapanRealEstateInvestment #IncomeProperty #CondominiumUnit #TokyoOffice #caprate #LongTermRates #InvestorProfile #UrbalyticsReferencesKenbiya Co., Ltd., “Survey of prospective real estate investors in the 5 central wards: About half report annual income of JPY 15 million or more; company employees’ average inquiry price reaches JPY 344 million, 5.9x the national level.” September 4, 2026 — https://www.kenbiya.com/ar/ns/research/kenbiya_report/10494.htmlJiji Press, “Meiji Yasuda to double real estate investment.” September 4, 2026 — https://news.yahoo.co.jp/articles/15cad469dfbbbc73bab8aef01348cfbcef5c4866Urbalytics (urbalytics.jp), aggregated for-sale and leasing data (whole-building yields and rent statistics, as of September 2026) — https://www.urbalytics.jp
A Fork on Tokyo’s Outer Ring: Ukima-Funado +72%, Higashi-Yamatoshi −10%

A Fork on Tokyo’s Outer Ring: Ukima-Funado +72%, Higashi-Yamatoshi −10%

Homebuyer demand priced out of the city center has only pushed to the edge of the 23 wards—at Ukima-Funado, average single-building price per tsubo jumped 71.7% over five quarters, while in the likewise “suburban” Higashiyamato City it fell by nearly 10%.The central six wards cool first as demand shifts outwardOn September 3, 2026, two seemingly unrelated headlines landed the same day. One quoted housing commentator Yukio Sakurai saying households earning around ¥5 million a year can still buy a 3LDK in Tokyo; the other reported at home’s July data showing the average price of resale condominiums in Tokyo’s 23 wards rose to ¥88.84 million, marking a 24th straight record.The signal only emerges when you read them together. Even as prices hit new highs, the month-on-month increase has narrowed to 0.2%, the third consecutive month of deceleration.More importantly, the 23 wards are diverging internally. Splitting the 23 wards into three buckets, at home reports July 2026 m/m changes of: the six central wards (Chiyoda, Chuo, Minato, Shinjuku, Bunkyo, Shibuya) −1.8%; the six southern and western wards +1.2%; and the eleven northern and eastern wards +1.8%.In other words, this isn’t “the 23 wards weakening across the board,” but rather the former leaders turning first. at home Lab’s executive director, 磐前淳子, frames it as “a pause after a sharp run-up, entering an adjustment phase of slower gains,” not an outright downturn.Average prices in the central six are already near ¥140 million. At that level, even dual-income high-earning “power couples” (パワーカップル) struggle to transact, and the domestic and foreign investors who underpinned the central rally have turned cautious. That displaced demand needs a new home.Streetscapes around stations on the outer edge of Tokyo’s 23 wardsUrbalytics data: Two “suburban” directions diverge completelyThe question is: where did that overflow demand actually go? Using Urbalytics’ station-catchment statistics, we placed the two areas Sakurai named—JR Saikyo Line’s Ukima-Funado Station and Seibu Haijima Line’s Higashi-Yamatoshi Station—on the same chart. The picture isn’t as simple as “the suburbs rise together.”Comparison of single-building price per tsubo, rent per m², and gross yield across the two station catchmentsIn the Ukima-Funado station catchment, average price per tsubo for single-building income properties (一棟収益物件) rose from ¥1.3577 million in 2025 Q3 to ¥2.3307 million in 2026 Q3—an aggregate five-quarter gain of 71.7%. Over the same period, the Higashi-Yamatoshi catchment retreated from ¥1.0665 million to ¥0.9602 million, a −9.97% decline.The rent side tells the same story. Across 183 active rental listings in Ukima-Funado’s catchment, the average asking rent is ¥3,426 per m²; in Higashi-Yamatoshi’s 102 samples it’s just ¥2,164—the former is 1.58× the latter.Urbalytics Insight Internal Urbalytics data show the gross yields (表面利回り) invert: among 19 single-building samples in Ukima-Funado, the average yield is 5.66% (median 5.32%); in Higashi-Yamatoshi’s 38 samples it’s as high as 8.28% (median 7.35%). Where prices run fast, yields compress; where prices fall, yields still sit above 8%—a clear expression of how capital is pricing the two locations.Note that quarterly sample sizes are uneven—single-building samples in 2025 Q3–Q4 are in the single digits and should be treated as indicative only. But in 2026 Q2–Q3, Ukima-Funado has 9 and 25 samples, while Higashi-Yamatoshi has 9 and 35, respectively; the directional trend holds.¥35 million vs ¥50 million: Two paths to a 3LDKSakurai’s affordability rule of thumb is simple: a reasonable home price is roughly 7–8× household annual income. For households earning ¥5–6 million, that puts the ceiling around ¥50 million.Within that budget, he pointed to two specific options.First, Kodaira City and neighboring Higashiyamato City in western Tokyo. Near Seibu Haijima Line’s Higashi-Yamatoshi Station, 3LDK condos built in 2014 and within a 10-minute walk sometimes list for around ¥35 million. Sakurai notes that recent new-build supply here has been heavy; when new supply is abundant, resale units struggle to command strong prices.Second, Ukima-Funado Station on the JR Saikyo Line within the 23 wards. Similar layouts run about ¥50 million. Sakurai is blunt: it’s a station with low name recognition but genuinely attractive pricing; across the Arakawa River lies Saitama Prefecture, and there are no large shopping malls nearby—factors that cap prices.Overlaying these paths with the earlier data clarifies the trade: the extra ¥15 million isn’t buying more space; it’s buying the fact of remaining inside the 23-ward administrative boundary. And the market has already priced that boundary: +71.7% versus −9.97% in price per tsubo.Scenes around stations along the Saikyo LineWhat this means for investorsFor overseas buy-and-hold investors, this dataset overturns a common simplification—“if the core is too expensive, go to the suburbs.” What’s really rising is the ring within the 23 wards that has not yet been fully priced.磐前 also notes that end-users leaving the core aren’t necessarily compromising. With the same budget, they can buy larger space, higher-spec buildings, or better education/childcare environments in the periphery—turning “settling for less” into an active choice. This is genuine end-user demand, not speculation, and it supports rents.On the sell side, the market is pivoting in tandem. On-the-ground feedback from agencies clusters around three themes: longer marketing periods, list prices failing to clear and being cut in stages, and inventories beginning to build.Risk warning The issue with nodes like Ukima-Funado is the speed of the move: after +71.7% over five quarters, average gross yield has compressed to 5.66%, and average single-building ticket size here is around ¥188 million. Buying the rip leaves a visibly thinner margin of safety. In Higashiyamatoshi, yields are still above 8%, but with price per tsubo trending lower, exit-liquidity risk warrants a separate assessment.Before making a specific decision, two checks are worth doing first.First, use Urbalytics’ station-catchment yield and rent statistics to locate the current asking price within the past five quarters’ price-per-tsubo percentiles—so you know where today’s quote sits in its historical range, rather than relying only on agents’ headline figures.Second, factor in interest-rate changes. 磐前’s reminder is plain: if mortgage rates rise while you wait for prices to fall, the higher interest burden could more than offset the decline in principal.Residential and transport environment around the stationConclusionTokyo in summer 2026 is switching from “everything is rising” to “know exactly where it’s rising.” The central six wards have fallen for three straight months, while the northern and eastern wards are still at +1.8%—that demarcation itself is the year’s key signal.For long-term holders, the opportunity lies in 23-ward edge stations with solid rent support and manageable ticket sizes; the risk is that these nodes have already run hard, yields have compressed, and the margin for error is shrinking.If you want to pinpoint where a given station now sits on this curve, Urbalytics’ station-catchment rent and gross-yield statistics provide a direct read.#TokyoRealEstate #ResaleCondos23Wards #UkimaFunado #HigashiYamatoshi #Kodaira #SaikyoLine #SeibuHaijimaLine #KitaWardInvestment #ItabashiWard #GrossYield #SingleBuildingIncomeProperties #TokyoHousingPrices #JapanRealEstateInvestment #RentalMarketLevels #UrbalyticsReferencesMONEY POST WEB, 2026, “Can households with annual income in the ¥5 million range still buy a 3LDK in Tokyo!? Housing commentator Yukio Sakurai explains notable areas along the Seibu Haijima Line and JR Saikyo Line”, https://news.yahoo.co.jp/articles/b4182bafe9d3ab70f05d711ea53707231d51daa0LIMO, 2026, “Resale condo prices in Tokyo’s 23 wards hit a record for the 24th consecutive month, but gains are slowing. The stance of buyers and sellers is also changing.”, https://news.yahoo.co.jp/articles/5588c1fedef00aef17c2efa8e4a99241ee375e01at home Co., Ltd., 2026, “Price trends for ‘resale condominiums’ in the Tokyo metropolitan area, July 2026”, https://athome-inc.jp/Tokyo Kantei, 2026, “Price of pre-owned condominiums converted to 70 m² (July 2026)”, https://www.kantei.ne.jp/Urbalytics, 2026, “Station-catchment rent statistics and single-building gross yield statistics (2025 Q3–2026 Q3)”, https://www.urbalytics.jp/
Average new-build price in Tokyo’s 23 wards hits ¥265 million: two markets behind a single number

Average new-build price in Tokyo’s 23 wards hits ¥265 million: two markets behind a single number

In July 2026, the average contracted price of newly built condominiums in Tokyo’s 23 wards reached a record high of ¥265.2 million, nearly doubling year-on-year. Meanwhile, over the same period in Azabu-Juban (麻布十番), the asking per tsubo (3.3 m²) price for whole-building income properties fell for four consecutive quarters by 16.87%—the for-sale and income-property markets are diverging in opposite directions.Data released on August 20 by the Real Estate Economic Institute (不動産経済研究所) pushed a long-running debate to an extreme. In July 2026, the average price per unit for newly built condominiums in the 23 wards was ¥265.2 million, YoY +96.0%, nearly doubling.This surpassed the previous peak of ¥217.5 million set in March 2023, marking the first time the 23-ward average entered the upper-¥200 million range. In the six central wards (Chiyoda, Chuo, Minato, Shinjuku, Bunkyo, Shibuya), the average price rose even more sharply to ¥436.99 million, more than doubling year-on-year.Minato, Azabu-Juban (麻布十番) area, where new-build prices hit a record highWhat investors should pause to consider is not the “new record” headline itself, but the mechanism that pushed prices to this level.The institute itself points to the answer. In Minato, a cluster of high-ticket projects averaging around ¥500 million per unit came to market, “lifting” the 23-ward average. According to FNN, the specific driver was a group of large-scale tower projects newly supplied in the Azabu-Juban area of Minato. Greater Tokyo’s July average also hit a record ¥164.93 million, YoY +63.7%. That backdrop is structural: projects in the 23 wards accounted for about half of Greater Tokyo’s supply, and a large-scale project in Tokyo’s Kita Ward averaging around ¥150 million per unit further raised the overall figure.Put differently, this record is a record of supply mix, not of price level. Only 2,145 units were sold across Greater Tokyo in July (YoY +6.9%). With such a small denominator, just a few ultra-expensive towers can move the statistical average anywhere. One more notable point in the same dataset: outside the 23 wards (e.g., Tama), the average price in the rest of Tokyo Prefecture rose YoY +87.9% to ¥105.59 million, exceeding ¥100 million for the first time. This indicates that higher pricing is not confined to the urban core but is rippling outward along the supply chain.Streetscape near Ichinobashi (一の橋), Azabu-JubanSo what does this record mean from an income-property investor’s standpoint? Focusing on the same area—Minato, Azabu-Juban—let’s check prevailing rents and realized income-property pricing.Urbalytics’ rent statistics and whole-building yield (gross yield) distribution tools show a picture quite unlike the “average new-build price doubled” headline. In the Azabu-Juban Station area sample of rental apartments, the average monthly rent is about ¥382,000, with an average unit size of 48.5 m², which translates into an average unit rent of about ¥6,800/m². Over the past five quarters, unit rents edged up only from ¥22,900/m² to ¥23,500/m², a cumulative increase of +2.62%, or less than 0.7% per quarter.Across 34 whole-building income properties currently listed in the same station area, the average asking price is ¥882.71 million, average annual rental income ¥27.88 million, and average gross yield 3.11% (median also 3.11%). The average asking price per tsubo fell from ¥9.4876 million/tsubo in Q4 2025 to ¥7.8871 million/tsubo in Q3 2026, a four-quarter cumulative decline of -16.87%.Commercial area around Azabu-Juban StationWith rents barely moving, asking prices for income properties are clearly retreating. Plot the two curves on the same chart and the most realistic price structure in Tokyo’s core today comes into view.Data source: UrbalyticsUrbalytics Insight What Urbalytics’ internal data highlight in this contrast is that under an extreme supply mix, the “average price” metric loses reference value. For-sale prices are determined by developers’ product strategies and land costs, while income-property prices are set by the division rent ÷ yield. If rents have risen just +2.62% over five quarters and rising funding costs are pushing up buyers’ required yields, fair value for income properties can only go down—even if a brand-new unit across the street sells for ¥500 million.The drivers behind this divergence aren’t obscure. Three forces are acting at once:1) Cost-push price rigidity. Tadashi Matsuda, Senior Chief Researcher at the Real Estate Economic Institute, notes that land and materials costs continue to rise and states that the upward price trend will persist. Once developers have acquired land and locked in construction costs, cutting prices themselves is almost impossible; they can only protect margins by pacing supply and focusing on the high-net-worth segment.2) A materially tighter funding environment. Diamond Real Estate Research Institute projects the Flat 35 mortgage rate will rise to 3.420% in September 2026, nearing the 3.5% threshold—high enough to change the pricing equation for income properties. When funding costs reach around 3%, an asset with a 3.11% gross yield produces little to no positive cash flow on a leveraged basis. Buyers’ remedy is simply to lower the purchase price.3) Demand-side stratification. The ¥500 million price tier is supported by high-net-worth buyers purchasing with cash, prioritizing wealth preservation and scarcity, and showing very low rate sensitivity. Income-property buyers, by contrast, rely on financing and cash flow underwriting and are highly rate-sensitive. Even within the same area, the two cohorts’ bidding power is diverging rapidly, producing the seemingly contradictory phenomenon that “new builds get pricier while income properties get cheaper.”Risk note Note that the quarterly sample size for whole-building data in Azabu-Juban is small (only 11 cases in 2026 Q3), so the four-quarter decline in per-tsubo prices should be treated as a reference value, not a precise conclusion. Also, swings in total asking amounts in the ¥150–200 million range partly reflect shifts in the mix of deal sizes coming to market, not purely downward price revisions. For a view of prevailing levels, one must ultimately return to closed-comparable analysis for individual assets.What about the outlook? In my view, “records” on average for-sale prices will keep appearing, while their meaning as a market thermometer will diminish further. As long as ultra-expensive core projects are introduced in batches and total supply remains at a low monthly level of around 2,000 units, a single project can rewrite the monthly average. The Real Estate Economic Institute also states the boundary condition for this view—Matsuda warned in the same release that “if rate increases accelerate, the market could cool.”For income-property investors, the real opportunity lies within this very divergence. While media attention is fixed on the ¥265 million headline, per-tsubo prices for whole buildings within the same ward and station area are adjusting at a pace of over 5% per quarter, with rent fundamentals barely deteriorating. This window has been rare in the city center over the past three years.Of course, a window is not the same as safety. The keys to judging whether this adjustment is a “chance” or “the start of a trend” are twofold. First, can rents hold or edge up in a rising-rate environment? Second, can you lock in an entry yield with a sufficient margin over funding costs? Statistical averages cannot answer these two questions—only by returning to rents and closed samples for specific station areas and asset types can you draw your own baseline. That is why we integrate rent levels, yield distributions, and price history on a single screen in Urbalytics.#TokyoRealEstate #23Wards #NewCondominium #Minato #AzabuJuban #NewBuildCondo #GrossYield #TsuboPrice #GreaterTokyoPropertyPrices #JapanRealEstateInvestment #IncomeProperty #WholeBuilding #Flat35 #JapanMortgageRates #UrbalyticsReferencesYomiuri Shimbun Online, 2026, “Average price of new condominiums in July hits a record ¥265.2 million in Tokyo’s 23 wards… Minato lifted prices,” https://www.yomiuri.co.jp/economy/20260820-GYT1T00268/Jiji Press, 2026, “New condos in Tokyo’s 23 wards hit a record ¥260 million—high-priced units in Minato lift overall average (July),” https://news.yahoo.co.jp/articles/e97b0984e5cc74a7efeed56465be4f1b7c592417FNN Prime Online, 2026, “Average price of new condos sold in Tokyo’s 23 wards in July was ¥265.2 million, a new record high,” https://news.yahoo.co.jp/articles/cd832db910f6abfff4f5a139f1b9f7d8cb7331b5Diamond Real Estate Research Institute (ダイヤモンド不動産研究所), 2026, “Will Flat 35 rates rise further in September to near 3.5%?! Forecasts for mortgage rates (floating and 10-year fixed)!” https://news.yahoo.co.jp/articles/ef76a04bde13ec5f38350d85ad72d82e6afb62b8Real Estate Economic Institute (不動産経済研究所), 2026, “Greater Tokyo Condominium Market Trends (July 2026),” https://www.fudousankeizai.co.jp/Urbalytics platform internal data (Azabu-Juban Station area rent statistics and whole-building yield statistics), retrieved August 20, 2026, https://www.urbalytics.jp/
03-4566-3208Contact