
How to Research Apartment Sale Prices Yourself|Calculating from Yield, Listings/Sales Examples, Public Data, and Using Urbalytics
Chen Tan (licensed real estate broker, 宅地建物取引士)Founder
20 min read
When you start considering selling an apartment, the first thing you probably want to know is, "How much is my property approximately worth?" If you grasp a rough market value by yourself before requesting an appraisal, it becomes easier to judge whether the quoted price is high or low.
This article explains how to research the market price of an entire apartment building on your own, in the order of rough estimates using income capitalization, nearby listing and sales examples, government public data, and how to use Urbalytics. Finally, we also summarize reasons why the "desk-based market price" you calculate might differ from the actual appraisal amount.
Key points of this article
- The market price of an entire apartment building can be roughly estimated by "annual rental income ÷ surrounding market yield," so for a property with an annual income of 7.2 million yen, at a yield of 4.6% it is about 156.5 million yen, and at 5.28% about 136.4 million yen.
- The capitalization rate (gross yield) for entire income properties near Akabane Station had a median of 4.60% in September 2026, with the P20 to P80 range being 4.00% to 5.28% (15 properties, Urbalytics Market Report).
- The national REINS Market Information targets condominiums and detached houses, and sales examples of entire apartment buildings are difficult to research, so it is practical to combine listed examples’ yield distribution with these data.
Apartment prices can be roughly estimated by “annual rental income ÷ market yield”
The price of an entire apartment building is significantly determined based on rental income, so dividing the annual rental income by the surrounding market capitalization rate gives you an approximate price range. This is a simplified version of the income capitalization method used in appraisals.
For example, if a property has 8 units each renting for 75,000 yen per month, the annual rental income at full occupancy is 7.2 million yen. If the surrounding gross yield is 4.6%, dividing 7.2 million yen by 4.6% results in approximately 156.5 million yen.
| Applied Yield | Estimated Price (Annual Income 7.2 million yen) |
|---|---|
| 4.00% (Akabane Station P20) | About 180 million yen |
| 4.60% (Akabane Station Median) | About 156.5 million yen |
| 5.28% (Akabane Station P80) | About 136.4 million yen |
The yields used are from the September 2026 Urbalytics Market Report (Akabane Station - Entire Income Properties, 15 properties).
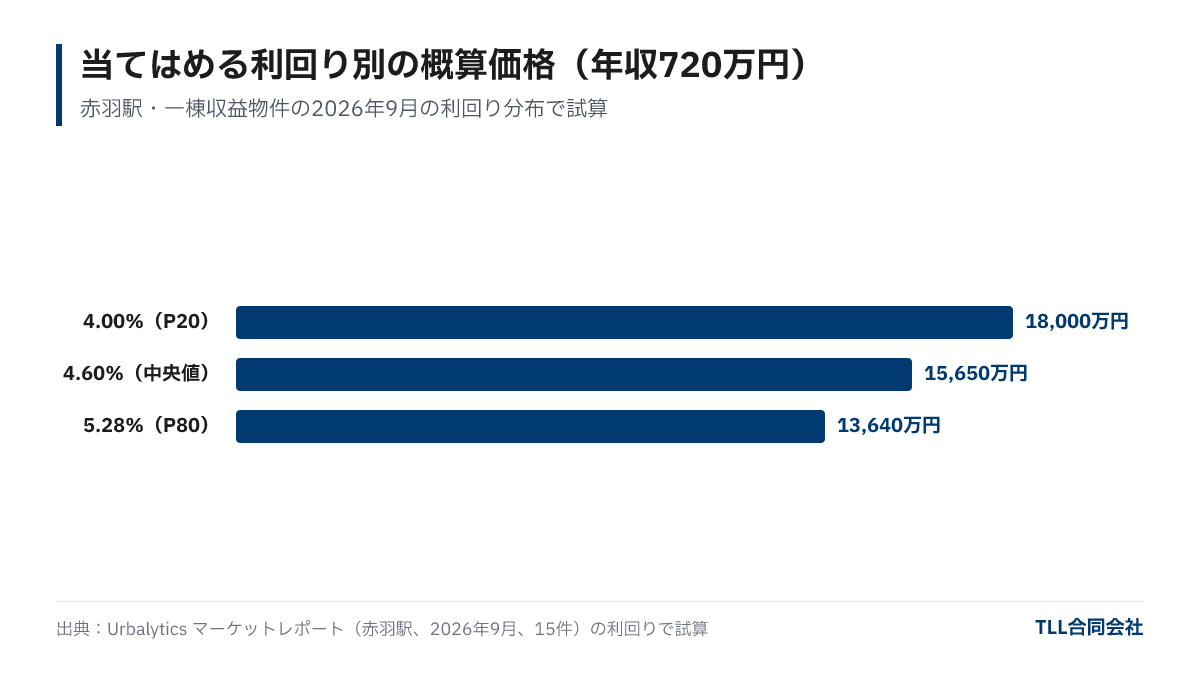
Even for the same station, the price range can vary by over 40 million yen depending on which yield is used. Therefore, it is important to capture the market value as a range rather than a single figure. Note that the rents used should be the actual rents of your property. For reference, Urbalytics rental listing data shows average rents around Akabane Station for units under 30 square meters were about 86,000 yen, with a median unit price of about 3,850 yen/sqm (277 listings, as of October 2, 2026). Detailed calculations of the income capitalization method are explained in How is the appraisal amount of an entire apartment determined?.
Difference between nearby listings and sales examples
When researching market yields, there are two types of examples: "listing examples" currently for sale, and "sales examples" which are actual closed transactions. Listings are the seller’s asking prices and tend to be higher than sales prices, so yield based on listing prices tends to be lower than yields based on sales prices, which you should keep in mind.

You can find listing examples by searching real estate portals for income properties near your station with similar structure, age, and total floor area. Be careful as the same property might be listed on multiple sites. Calculating averages without excluding duplicates can overweight some properties. Also exclude properties that differ from yours, such as leasehold land, properties impossible to rebuild, or buildings mainly for offices or stores, since they often show abnormally high yields.
Sales examples for entire apartment buildings are limited publicly. Some data is available from the government databases introduced below, but usually does not allow calculation of yields as the properties are anonymized.
Researching with public data: Real Estate Information Library and REINS
Free government public data resources include the Ministry of Land, Infrastructure, Transport and Tourism’s (MLIT) “Real Estate Information Library” and the Designated Circulation Organization (REINS) “REINS Market Information.”
- Real Estate Information Library (MLIT): Contains “Real Estate Transaction Price Information” based on surveys from transaction parties, processed sales price info from REINS, and land price surveys on maps. It allows searches for transactions including land and building together, but locations are by district and rental income is not listed, so it is not usable for yield calculations. It is useful for confirming land price levels.
- REINS Market Information: Publishes sales prices registered on REINS in an anonymized form. Targets condominiums and detached houses; entire apartment buildings are excluded.
Land prices obtained from public data serve as a rough estimate of the net asset value (land plus building). In many cases, financial institutions determine loans by looking at both the income price and net asset price for entire apartment buildings, so confirming land value is meaningful. The relationship is explained in detail at Relationship between income property prices and bank valuations.
Viewing station-specific yield distribution using Urbalytics
If you want to check market yield for entire apartment buildings by station, you can use the publicly available market reports from Urbalytics. Operated by TLL, Urbalytics aggregates monthly listing information for Tokyo and surrounding prefectures, publishing median gross yields and their distribution by station and municipality.
- Open the Market Report and select your prefecture under "By Station."
- Select the nearest station and open the "Entire Income Properties" page.
- Check the median gross yield, P20–P80 range (20th to 80th percentile), number of data points, and aggregation month.
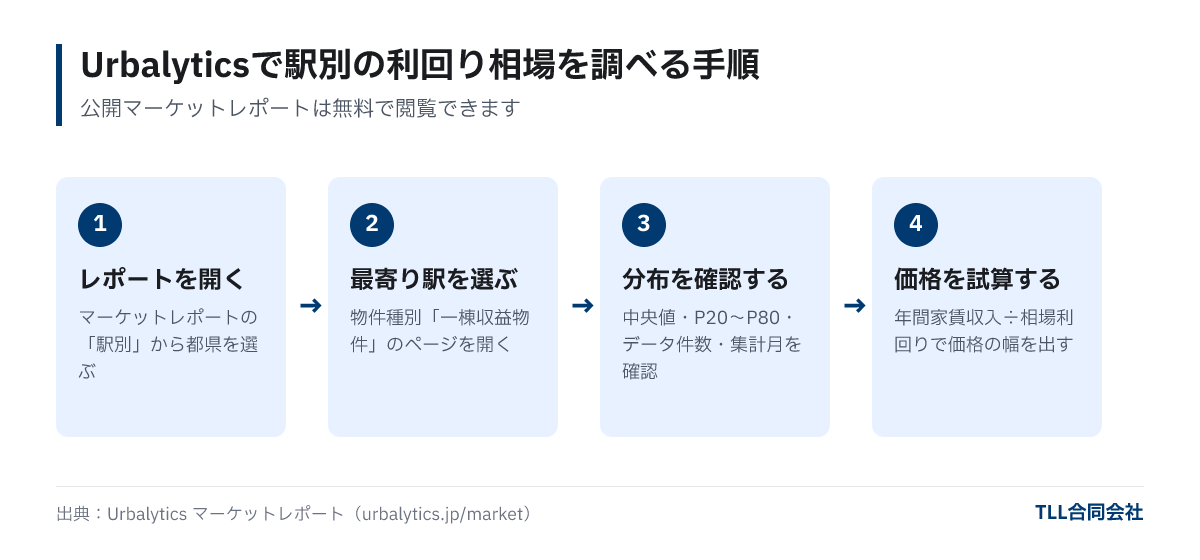
As examples, the numbers from the published reports and TLL’s aggregated listings data (2026 Jan–Sep, duplicates excluded) for three stations are listed below.
| Nearest Station | Sept 2026 Median (Count) | Sept 2026 P20–P80 | Jan–Sep 2026 Median (Count) | Jan–Sep 2026 1st–3rd Quartile |
|---|---|---|---|---|
| Akabane | 4.60% (15 properties) | 4.00%–5.28% | 4.8% (22 properties) | 4.2%–7.0% |
| Kita-Senju | 4.00% (11 properties) | 3.44%–4.94% | 5.2% (30 properties) | 4.5%–5.9% |
| Kamata | 5.01% (19 properties) | 4.30%–5.85% | 5.1% (32 properties) | 4.3%–6.1% |
Source: The first two columns are from Urbalytics Market Reports (Akabane, Kita-Senju, Kamata, aggregated in September 2026). The right two columns are TLL’s aggregation of Urbalytics listed entire properties priced in Tokyo under 400 sqm, from January to September 2026, excluding those with zero or unknown annual income and duplicate listings of the same property. All gross yields are calculated as annual expected income ÷ listing price. Data aggregated on October 2, 2026.
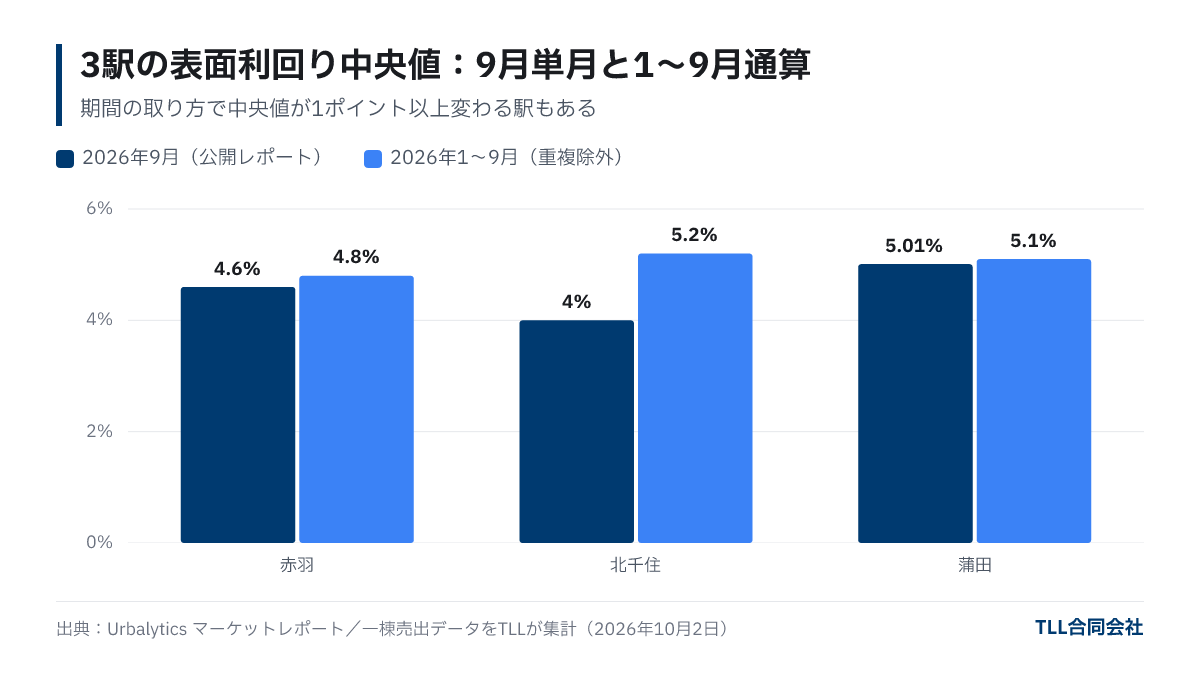
For stations like Kita-Senju, the median can change by more than 1 percentage point depending on the period, from 4.00% for September alone to 5.2% over January to September. With 10–20 listings per month, even one entry or exit can sway the number. When researching market values, it is recommended not to judge by single-month figures alone but to consider the period, number of data points, and distribution range together.
Reasons why desk-based market values differ from actual appraisal amounts
The market values presented so far are only approximate ranges for "average properties in the area." Actual appraisal amounts fluctuate based on property-specific conditions such as:
- Rent and occupancy status: Asking rents under full occupancy are higher or lower than market, many vacancies, or longstanding tenants paying below-market rent.
- Building condition and legal compliance: Repair history of exterior walls, roofs, plumbing; whether certificate of completion is present; whether floor area ratio is exceeded.
- Rights conditions: Leasehold land, lack of rebuilding rights, private road burdens, etc. These issues are explained in Can properties that are impossible to rebuild, on leasehold land, or old apartments be sold?.
- Loan availability: Remaining useful life based on structure and building age, and land valuation affect how much loan the buyer can secure.
- Sales method: Whether to spend more time selling via brokerage or sell quickly through direct purchase affects price. See Which is better for selling an entire apartment building: direct purchase or brokerage? for comparison.

The desk-based market value is used as a "reference to verify whether an appraisal amount is reasonable," and actual sale prices should be confirmed through an appraisal considering rent rolls and building conditions for a more accurate process.
Frequently Asked Questions
Q. Can I check apartment market prices for free?
Yes. Listing data on income property portals, MLIT’s Real Estate Information Library, and Urbalytics’ publicly available market reports can be viewed free of charge. Sales examples for entire apartment buildings are limited publicly, so it is practical to view them in combination with listing yield distributions.
Q. Should I calculate using gross yield or net yield?
For comparisons with surrounding market rates, gross yield based on publicly available data is generally used. Net yield, which deducts management fees, maintenance costs, fixed asset tax, etc., helps buyers confirm decisions. Preparing expense data for appraisals accelerates the process.
Q. Can I see actual closing prices for entire apartments on REINS?
The general REINS Market Information targets condominiums and detached houses; entire apartment buildings are not included.
Q. Why is there a big difference between the market price I researched and the appraisal amount?
The difference reflects rent actuals, vacancies, repair conditions, rights issues, and loan availability differing from average properties in the area. If the difference is large, confirm which factors cause the discrepancy with the appraisal source.
Summary
- The market price of an entire apartment building can be roughly estimated by "annual rental income ÷ market yield," and for an annual income of 7.2 million yen with a yield range of 4.00% to 5.28%, the price range is about 136.4 million to 180 million yen.
- Listing examples tend to show yields lower than sales, so exclude duplicates and special cases when reviewing.
- Public data is helpful to confirm land value, but REINS’ general site does not include entire apartment buildings.
- According to Urbalytics station reports, median gross yields in September 2026 were 4.60% for Akabane, 4.00% for Kita-Senju, and 5.01% for Kamata.
Once you have estimated the desk-based market value, the next step is to verify it against actual property documents. Free appraisal services provide property-specific appraisal amounts and rationales based on rent rolls and building conditions.
Featured image (illustration): Photo: Kelly Sikkema / Unsplash
About this article
- Author
- Chen Tan(Founder)Qualifications: Real Estate Transaction Specialist, Building Management Specialist, US Certified Buyer's Agent
A serial entrepreneur spanning real estate investment, fund formation, and digital strategy. At McKinsey & Company, he led organizational restructuring, DX, and new business strategy projects for financial institutions and real estate developers across Japan and Greater China. At Amazon Japan, he served as the design lead for large-scale e-commerce products. Since founding TLL, he has overseen the full cycle from acquisition, repositioning, and operation of income-producing properties to fund formation, while building a data-driven investment decision model.
View profile → - Publisher
- TLL合同会社宅地建物取引業 東京都知事(1)第108202号住宅宿泊管理業 国土交通大臣(01)第F03424号
Data in this article cite their source and as-of date. Market conditions and regulations change, so check the latest information and consult a professional before deciding. Translated from the Japanese original.