
Difference Between Gross Yield and Net Yield - Formulas, Expense Breakdown, and Estimated Gap for Tokyo’s 6 Stations
Emi Tokudomi (licensed real estate broker, 宅地建物取引士)Acquisition Staff
22 min read
The first numbers you usually see on income property sales brochures or portal sites are the "yield ○%" figures. However, many of these numbers represent the gross yield, which is the value before deducting management fees, taxes, and vacancy losses. The yield that more accurately reflects the income actually remaining is the net yield, and the difference between the two can be over one percentage point depending on the property.
This article explains the formulas for gross yield and net yield, the breakdown of expenses that cause the difference, and estimates how far apart the gross and net yields are based on sales data from one-building properties in Tokyo (Urbalytics). Since expense ratios vary greatly by property, assumptions and their rationales are shown in the estimates.
Key points of this article
- Gross yield is calculated as "annual rent assuming full occupancy ÷ property price," while net yield is "(annual rental income − vacancy loss − operating expenses) ÷ (property price + purchase-related costs)," differing by whether expenses and additional costs are included.
- The median gross yield for one-building properties at six Tokyo stations (Ikebukuro, Nakano, Akabane, Kitasenju, Kamata, Kinshicho) ranged from 4.3% to 5.2% (based on sales listings with price changes from October 2, 2025 to October 2, 2026, excluding duplicates, Urbalytics, compiled October 2, 2026).
- Assuming expense rate as 20–30% of full rent and purchase costs as 7% of property price, net yield is 1.1 to 1.8 percentage points lower than gross, ranging from 2.8% to 3.9%.
What is the difference between gross and net yield?
The difference is whether expenses and purchase-related costs are included. Gross yield (also called gross rental yield) is rent divided by property price, used as a rough comparison metric between properties. Net yield (also called net operating income yield or NOI yield) is the net income after deducting operating costs, divided by the total amount actually paid upon purchase.
The formulas are as follows.
- Gross yield = annual rent assuming full occupancy ÷ property price × 100
- Net yield = (annual rent assuming full occupancy − vacancy and delinquency loss − annual operating expenses) ÷ (property price + purchase-related costs) × 100
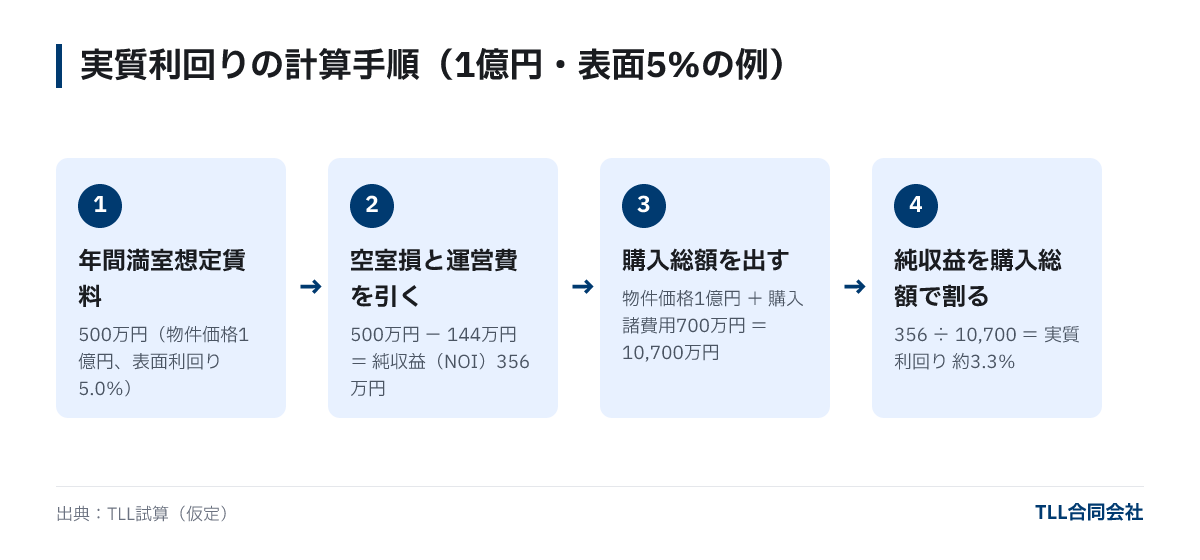
For example, if the property price is 100 million yen and the annual full occupancy rent is 5 million yen, the gross yield is 5.0%. If vacancy loss plus operating expenses total 1.44 million yen, and purchase-related expenses are 7 million yen, then net yield is (5,000,000 − 1,440,000) ÷ 107,000,000 = about 3.3%. The difference between the two can be 1.7 percentage points for the same property, depending on which figure you focus on.
Note that the definition of net yield differs slightly depending on the company or source. Some calculations do not include purchase costs in the denominator, or vacancy loss in expenses. When comparing, it is important to standardize the calculation assumptions. For terminology clarification, also see Glossary of Real Estate Investment Terms.
Breakdown of expenses deducted from net yield

Operating expenses for entire-building properties are generally divided into the following seven categories. Unlike unit condominiums, owners themselves bear repairs and maintenance of common areas in entire-building properties, so there are more items involved.
| Category | Contents | How amounts are determined / Approximate guide |
|---|---|---|
| Vacancy / Delinquency Loss | Period vacant from move-out to next tenant, uncollected rent | Varies greatly depending on location, layout, building age. Assumed as 5% of full rent in estimates |
| Management Fee (PM) | Tenant communication, rent collection, move-out inspections | Generally about 3–5% of collected rent |
| Building Management Fee (BM) | Cleaning of common areas, electricity/water for common spaces, fire safety inspections, elevator checks | Varies by building size and facilities; presence of elevator greatly affects cost |
| Repairs | Restoration, replacement of equipment like heaters and air conditioners, planned repairs like exterior walls and rooftop waterproofing | Increase with building age. Consider as long-term reserves, not just single year |
| Property Tax and City Planning Tax | Local taxes on land and building | Property tax assessment value × 1.4% (standard rate); city planning tax up to 0.3% of assessment value. Special provisions apply for residential land under 200㎡, reducing property tax base to one-sixth and city planning tax to one-third |
| Insurance Premiums | Fire insurance, earthquake insurance, liability insurance for facilities | Varies by structure, location, coverage. Earthquake insurance set between 30–50% of fire insurance amount |
| Tenant Recruitment Expenses | Advertisement fees to brokers, brokerage commissions, listing photos, etc. | Depends on local market practices and tenant turnover frequency |
Property tax and city planning tax are levied on the assessment value, not the sale price, so cannot be exactly reverse-calculated from purchase price. It is recommended to request tax statements (property tax payment notices) from the seller before purchase to check actual amounts.
Meanwhile, loan repayments, depreciation, and income tax are not included in net yield. Net yield measures the property’s own earning power, so aspects influenced by loan terms or personal tax rates are handled separately in cash flow calculations. Loan conditions are explained in Basics of Real Estate Investment Loans.
Stacking expenses for a 100 million yen, 5% gross yield one-building property
Applying these categories to a one-building apartment priced at 100 million yen with annual full occupancy rent of 5 million yen results in an example breakdown below. These figures are assumptions made by TLL for estimation; actual ratios vary per property.
| Category | Annual Amount (10,000 yen) | Percentage of Full Rent | Assumption |
|---|---|---|---|
| Vacancy / Delinquency Loss | 25 | 5.0% | 5% vacancy throughout the year |
| Management Fee | 24 | 4.8% | 5% of collected rent 4.75 million yen |
| Building Management Fee | 15 | 3.0% | Small property without elevator |
| Repairs (including reserves) | 30 | 6.0% | Smoothed over restoration and planned repairs |
| Property Tax & City Planning Tax | 35 | 7.0% | Varies by assessment value, check actual statement |
| Insurance Premiums | 5 | 1.0% | Annualized fire and earthquake insurance |
| Tenant Recruitment Expenses | 10 | 2.0% | Several tenant turnovers per year |
| Total | 144 | 28.8% |
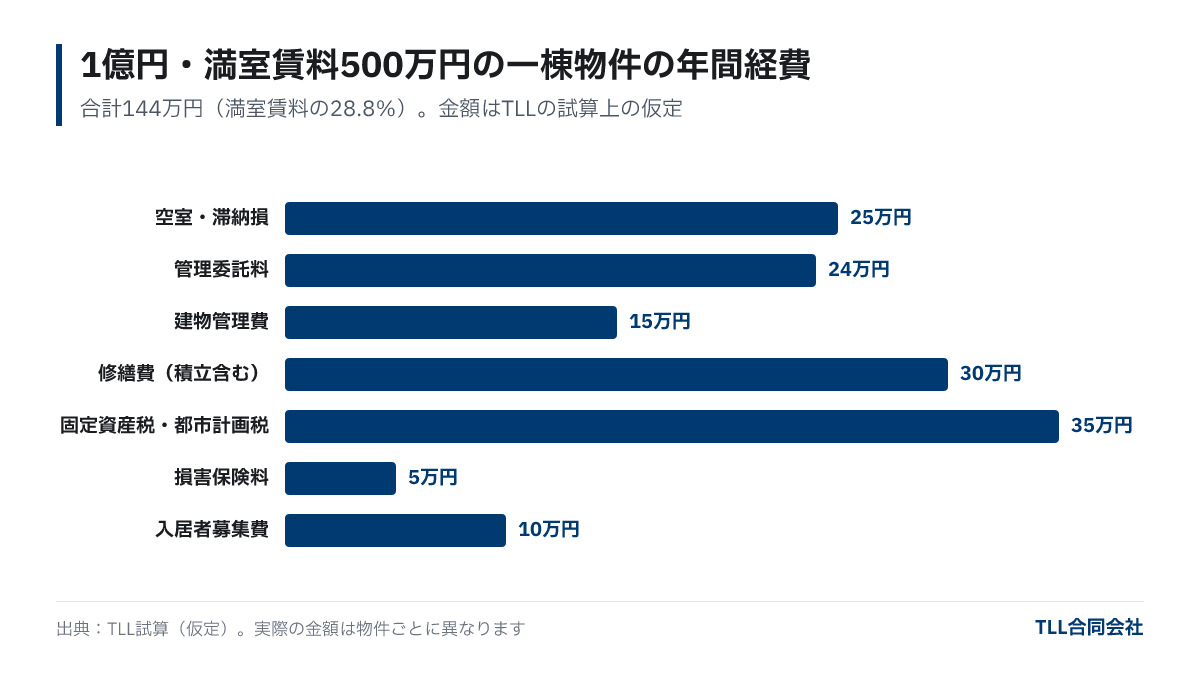
Net operating income (NOI) is 5,000,000 − 1,440,000 = 3,560,000 yen. Assuming purchase-related costs (brokerage fees, registration fees, real estate acquisition tax, etc.) of 7% or 7 million yen of the property price, net yield is 3,560,000 ÷ 107,000,000 = about 3.3%. The breakdown and calculation method for purchase-related costs are detailed in Purchase Costs for Income Properties with the 100 million yen example.
Estimated gap between gross and net yields for one-building properties at Tokyo’s 6 stations

Applying this approach to actual sales data, we aggregated gross yields by station from the one-building properties (BUILDING) listed in Urbalytics in Tokyo, and estimated net yields assuming three different expense rates.
| Nearest Station | Number of Listings | Median Gross Yield | Average Gross Yield | Net Yield, 20% Expense Rate | Net Yield, 25% Expense Rate | Net Yield, 30% Expense Rate |
|---|---|---|---|---|---|---|
| Ikebukuro | 75 | 4.81% | 5.38% | 3.60% | 3.37% | 3.15% |
| Nakano | 46 | 4.38% | 4.70% | 3.27% | 3.07% | 2.87% |
| Akabane | 34 | 4.80% | 5.69% | 3.59% | 3.36% | 3.14% |
| Kitasenju | 53 | 5.18% | 5.59% | 3.87% | 3.63% | 3.39% |
| Kamata | 52 | 5.01% | 5.15% | 3.75% | 3.51% | 3.28% |
| Kinshicho | 36 | 4.30% | 5.10% | 3.21% | 3.01% | 2.81% |
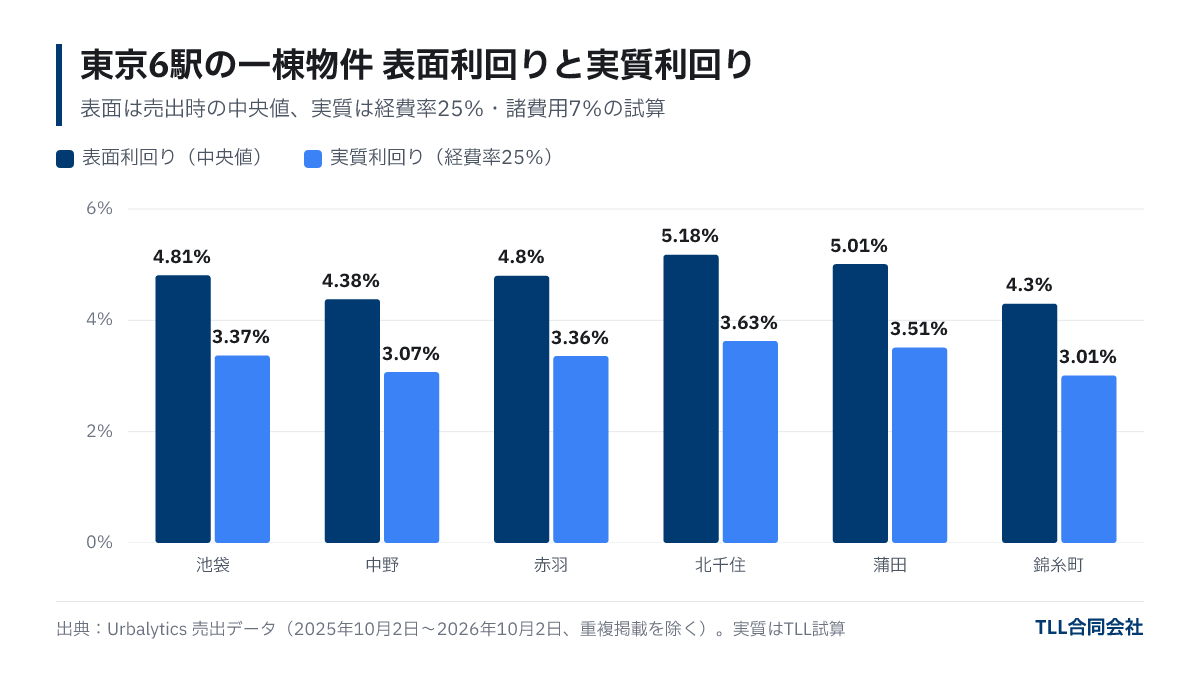
Source: Urbalytics sales data (one-building properties in Tokyo per nearest station). Properties listed or with price changes between October 2, 2025 and October 2, 2026, excluding duplicates across multiple sites (gross yields under 1% or above 25% excluded), compiled October 2, 2026. Gross yield is annual income displayed at listing divided by listing price, not contract price. The annual income may be full occupancy assumed or current rent depending on property. Net yield estimated as "median gross yield × (1 − expense rate) ÷ 1.07", where expense rate (including vacancy loss) and 7% purchase costs are TLL assumptions.
Three insights from the table:
- The gap is 1.1 to 1.8 percentage points. Viewing the median case with 25% expenses, net yields are 1.3 to 1.5 points lower than gross yields at every station. Even properties with gross yields in the 5% range typically have net yields around mid-3%.
- Averages are higher than medians. At every station, the average yield exceeds the median due to some extreme high-yield properties such as old or non-rebuildable ones raising the average. The median better reflects typical market conditions.
- A 5-point difference in expense rate shifts net yield by about 0.2 points. Even for the same property gross yield, differences in elevator presence or repair costs by building age cause expense rates to vary. Relying only on gross yield can overlook this difference.
Documents to check when evaluating net yield

You cannot calculate net yield from sales brochure numbers alone. It is standard practice to request the following documents from the seller at the consideration stage, and fill in the actual expense amounts.
- Rent roll (rental agreement summary): Rent, contract start date, and vacancy status per unit. This also clarifies whether the displayed yield is full occupancy assumed or current.
- Property tax and city planning tax statements: Actual tax amounts.
- Management contracts and building management estimates: Management fee rates and cleaning/inspection costs.
- Repair history: Dates of repairs for exterior walls, rooftop waterproofing, plumbing, etc. Recent major repairs reduce short-term repair expenses.
- Profit and loss results for the past 1–2 years: Actual vacancy periods and recruitment expenses.
If rents in some units are set above market, rents may drop after vacancy. Check if the full occupancy rent is reasonable compared to nearby listings. The overall property selection process including location, building, and rights is summarized in How to Choose Income Properties. Additionally, since financial institutions evaluate properties by both yield and asset valuation, reading Relationship Between Property Price and Bank Valuation helps assess financing ease.
Frequently Asked Questions
Q. What is a good net yield percentage?
There is no fixed standard. When purchasing with financing, it is common to judge based on the gap (yield spread) between net yield and the borrowing interest rate. It is recommended to compare net yields calculated under the same assumptions for properties in the same area and age range.
Q. Are brochure yields based on full occupancy?
It varies per property. Some show full occupancy assumptions and others use current rents. Some vacant properties may show full occupancy yields. Confirm current occupancy and rent in the rent roll.
Q. Are loan repayments included in net yield?
No. Net yield measures the property’s earning power. The amount remaining after loan repayments is calculated separately as cash flow (NOI minus annual loan payments).
Q. Is the difference between gross and net yields different for unit condominiums versus entire buildings?
Unit condominiums have fixed monthly management fees and sinking fund payments to the management association, making expenses easier to predict. Entire-building properties have owner-planned repair timing and amounts, so expense ratios vary more depending on building age and condition.
Summary
- Gross yield is rent ÷ price; net yield is (rent − vacancy loss − operating expenses) ÷ (price + additional costs). Standardize calculation assumptions when comparing.
- Median gross yield for one-building properties at Tokyo’s 6 stations is 4.3% to 5.2% (October 2025 to October 2026, excluding duplicates, Urbalytics sales data).
- Assuming 20–30% expense rate and 7% purchase costs, net yield is 1.1 to 1.8 points lower at 2.8% to 3.9%.
- Property tax, repairs, and management fees vary greatly, so confirm actual amounts via rent roll, tax statements, and repair history before deciding.
Income properties handled by TLL can be viewed with prices and yields on the member page (free registration).
Eyecatch image (image): Photo: Jakub Żerdzicki / Unsplash
About this article
- Author
- Emi Tokudomi(Acquisition Staff)Qualifications: Real Estate Transaction Agent
After working in real estate sales support, rental property management, and brokerage, now engages in acquisition operations. Holds a Real Estate Transaction Agent license and bookkeeping qualifications, and supports property value with extensive hands-on experience and specialized expertise.
View profile → - Publisher
- TLL合同会社宅地建物取引業 東京都知事(1)第108202号住宅宿泊管理業 国土交通大臣(01)第F03424号
Data in this article cite their source and as-of date. Market conditions and regulations change, so check the latest information and consult a professional before deciding. Translated from the Japanese original.