Tokyo Stations with Significant Changes in Gross Yield from May 2026【September 2026】Comparison of 20 Stations with 15+ Income Property Listings
Xingkai LuoNew Business
20 min read
When considering the purchase of entire apartment buildings or condominiums, you naturally want to know "how the yields at this station have been moving recently." Movements that are not visible in average figures by ward sometimes appear clearly in data by station. However, when looking at station-level data, the smaller number of listings makes the figures more volatile, presenting a challenge.
In this article, we summarize how the gross yields of one-building income properties at stations in Tokyo have changed from May to September 2026, based on the publicly available Urbalytics market report (station-based, September 2026 compilation) operated by TLL LLC. Because station-level data by property type has only been independently published since May 2026, this article compares figures to those of May 2026, not year-over-year. To exclude stations with few listings, only those with 15 or more data points in both May and September are included.
Key points of this article
- Among 20 Tokyo stations with 15 or more listings in both May and September 2026, the station where the median gross yield of one-building income properties increased the most was Minami-Senju station (from 4.16% to 5.66%, +150bps), and the station where it decreased the most was Kanamachi station (from 6.25% to 5.70%, −55bps) (Urbalytics market report, sales data).
- Yields rose at 14 of the 20 stations and fell at 6 stations, while the median for all of Tokyo remained unchanged at 5.00% during the same period.
- Even at stations with significant changes, the median over the most recent 12 months (excluding duplicate listings) was 4.97% (44 listings) for Minami-Senju and 5.75% (47 listings) for Kanamachi, suggesting that many of the sharp single-month changes may reflect shifts in the mix of properties rather than market trends alone.
Why Compare to May 2026 Rather Than Year-Over-Year?
The Urbalytics station-based report independently publishes data sorted by property type starting from May 2026 monthly. Data prior to that month is not organized for station-level comparison. Therefore, this article compares the earliest published month, May 2026, with the most recent, September 2026. For year-over-year comparisons, data aggregated by ward (available from December 2022 onward) is more appropriate. Year-over-year changes by ward are summarized in the "Tokyo 23 Wards One-Building Income Property Gross Yield Ranking【September 2026】" report.
Also, because station-level data includes fewer listings than ward-level data, only 20 stations within Tokyo had 15 or more listings in both May and September. Urbalytics publishes data from stations with 10 or more listings, but months with around 10 to 30 listings are considered sensitive to changes of a single listing impacting the median. To improve reliability, this article sets the lower limit at 15 listings.
Stations with Large Gross Yield Changes (May to September 2026)
The stations with the largest increases were Minami-Senju (+150bps), Minowa (+112bps), Kita-Ikebukuro (+72bps), Nogata (+68bps), and Ogikubo (+51bps). The stations with declines were Kanamachi (−55bps), Kameari (−47bps), Arai-Yakushi-Mae (−19bps), Hachioji (−15bps), Oji (−13bps), and Sangen-Jaya (−9bps).
| Station | Ward/District | May 2026 (Listings) | September 2026 (Listings) | Change |
|---|---|---|---|---|
| Minami-Senju Station | Arakawa | 4.16% (15 listings) | 5.66% (18 listings) | +150bps |
| Minowa Station | Taito | 4.30% (15 listings) | 5.42% (24 listings) | +112bps |
| Kita-Ikebukuro Station | Toshima | 4.64% (16 listings) | 5.36% (16 listings) | +72bps |
| Nogata Station | Nakano | 4.59% (17 listings) | 5.27% (26 listings) | +68bps |
| Ogikubo Station | Suginami | 4.49% (15 listings) | 5.00% (20 listings) | +51bps |
| Shin-Koiwa Station | Katsushika | 5.18% (15 listings) | 5.64% (32 listings) | +46bps |
| Ikebukuro Station | Toshima | 4.47% (22 listings) | 4.81% (39 listings) | +34bps |
| Koenji Station | Suginami | 4.51% (16 listings) | 4.83% (24 listings) | +32bps |
| Akabane Station | Kita | 4.30% (15 listings) | 4.60% (15 listings) | +30bps |
| Koiwa Station | Edogawa | 5.11% (22 listings) | 5.41% (23 listings) | +30bps |
| Kamata Station | Ota | 4.74% (16 listings) | 5.01% (19 listings) | +27bps |
| Tobu-Nerima Station | Itabashi | 4.92% (23 listings) | 5.11% (25 listings) | +19bps |
| Otsuka-Ekimae Station | Toshima | 4.11% (16 listings) | 4.29% (16 listings) | +18bps |
| Waseda Station | Shinjuku | 4.33% (18 listings) | 4.40% (17 listings) | +7bps |
| Sangen-Jaya Station | Setagaya | 4.05% (15 listings) | 3.96% (18 listings) | −9bps |
| Oji Station | Kita | 4.70% (17 listings) | 4.57% (16 listings) | −13bps |
| Hachioji Station | Hachioji | 7.86% (23 listings) | 7.71% (18 listings) | −15bps |
| Arai-Yakushi-Mae Station | Nakano | 5.00% (15 listings) | 4.81% (17 listings) | −19bps |
| Kameari Station | Katsushika | 5.75% (15 listings) | 5.28% (16 listings) | −47bps |
| Kanamachi Station | Katsushika | 6.25% (16 listings) | 5.70% (16 listings) | −55bps |
Source: Urbalytics Market Report (by station, Tokyo, gross yields of one-building income properties, aggregations for May and September 2026). Monthly medians of sales listings (including active sales and contracts) with outliers removed using the IQR method. Subject to stations with 15+ listings in both months, 20 stations total. Basis points (bps) = 0.01 percentage points. Viewed October 2, 2026.
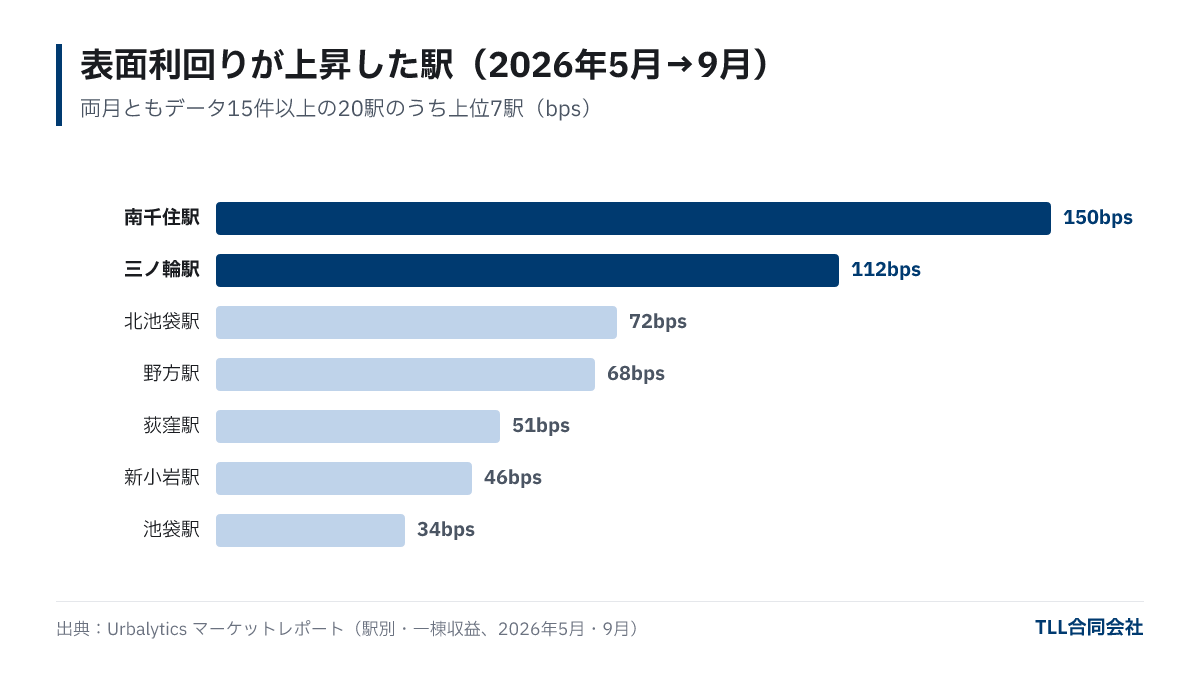
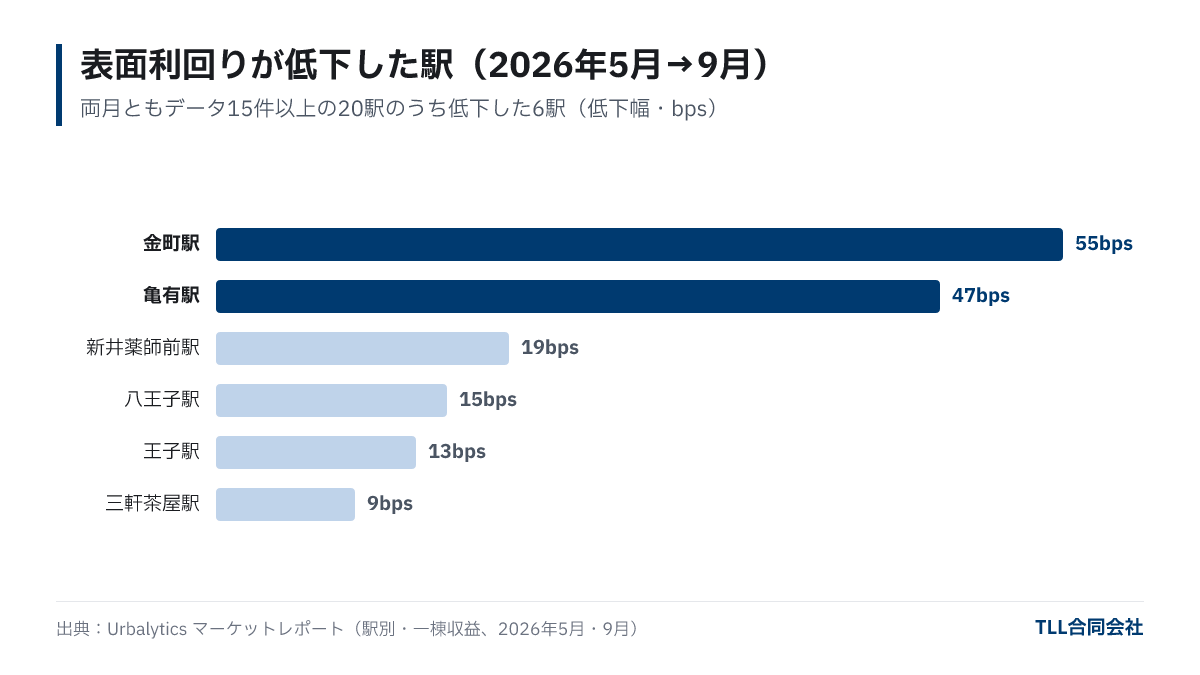
An increase in yield means prices decreased assuming rent remained unchanged, while a decline means prices rose. However, the median at each station reflects the middle value among around 15 to 40 properties listed for sale that month. The figures can shift greatly if expensive new or large properties are removed or older properties added.
Changes Look Different When Compared to 12-Month Median
To check whether single-month changes reflect shifts in property supply, we aggregated the gross yields of listings with price updates made in the most recent 12 months (October 2025 to October 2026) for the 10 stations with the largest changes, using Urbalytics data (duplicate listings across multiple sites combined).
| Station | May 2026 | September 2026 | Most Recent 12-Month Median (Listings) | 10th to 90th Percentile Range |
|---|---|---|---|---|
| Minami-Senju Station | 4.16% | 5.66% | 4.97% (44 listings) | 3.94–8.44% |
| Minowa Station | 4.30% | 5.42% | 5.13% (59 listings) | 3.83–9.59% |
| Kita-Ikebukuro Station | 4.64% | 5.36% | 4.55% (32 listings) | 4.13–6.19% |
| Nogata Station | 4.59% | 5.27% | 5.20% (57 listings) | 4.16–7.73% |
| Ogikubo Station | 4.49% | 5.00% | 4.85% (44 listings) | 3.85–6.73% |
| Kanamachi Station | 6.25% | 5.70% | 5.75% (47 listings) | 4.00–9.24% |
| Kameari Station | 5.75% | 5.28% | 5.78% (52 listings) | 4.20–8.44% |
| Arai-Yakushi-Mae Station | 5.00% | 4.81% | 4.77% (44 listings) | 4.00–10.21% |
| Hachioji Station | 7.86% | 7.71% | 7.95% (76 listings) | 6.00–10.05% |
| Oji Station | 4.70% | 4.57% | 4.84% (38 listings) | 3.90–6.42% |
Source: Urbalytics Market Report (station-by-station, monthly medians), and Urbalytics sales data (properties listed or with price changes recorded between October 2, 2025 and October 2, 2026. After removing duplicates; excluding yields below 1% and above 25%). The 12-month data for Kanamachi station includes the Keisei Kanamachi station group. Data compiled October 2, 2026.
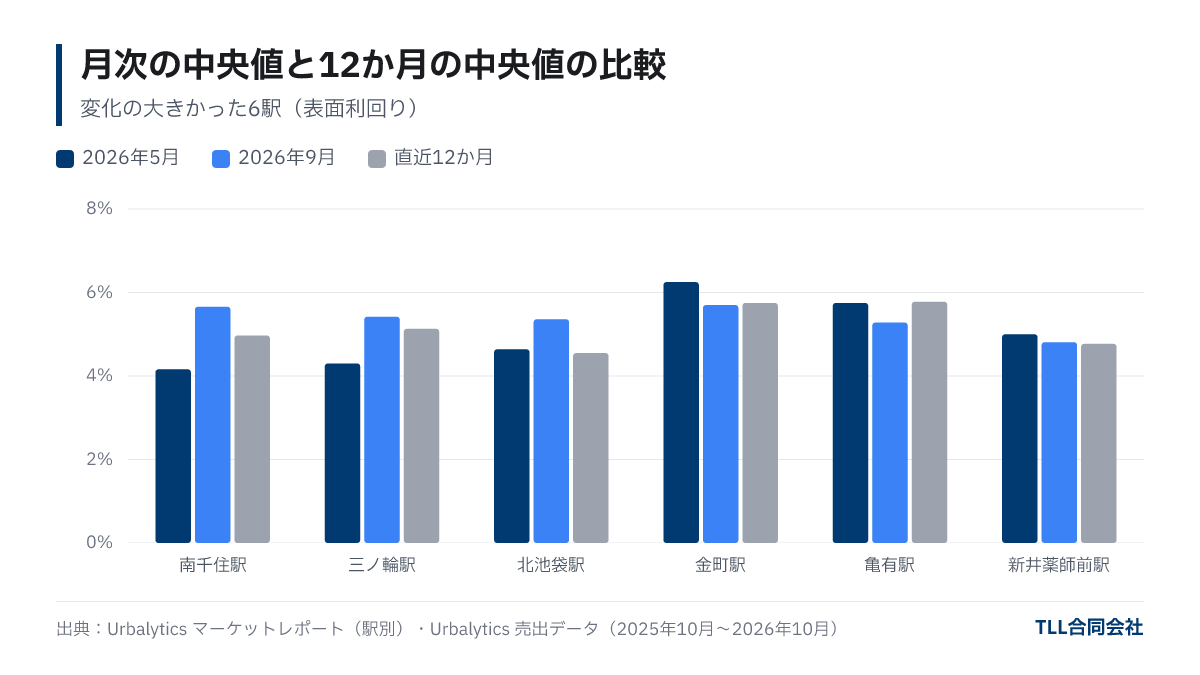
For example, the 12-month median gross yield for Minami-Senju station (4.97%) falls between the May (4.16%) and September (5.66%) figures. Kanamachi (5.75%) and Minowa (5.13%) exhibit a similar pattern. On the other hand, Kita-Ikebukuro’s 12-month median (4.55%) is lower than May’s 4.64%, making September’s 5.36% relatively high within its distribution. Therefore, it is premature to conclude that a station has become undervalued or overvalued based solely on sharp single-month shifts.
Possible reasons for these changes include: (1) differences in age, size, or structure of properties listed that month; (2) revisions of listing prices (price reductions); and (3) adjustments in rents. This data alone cannot identify the primary cause. On each station’s page, median listing prices and building sizes are also published, so if these move significantly alongside yield, it is likely the changes reflect shifts in property composition.
What Investors Should Check
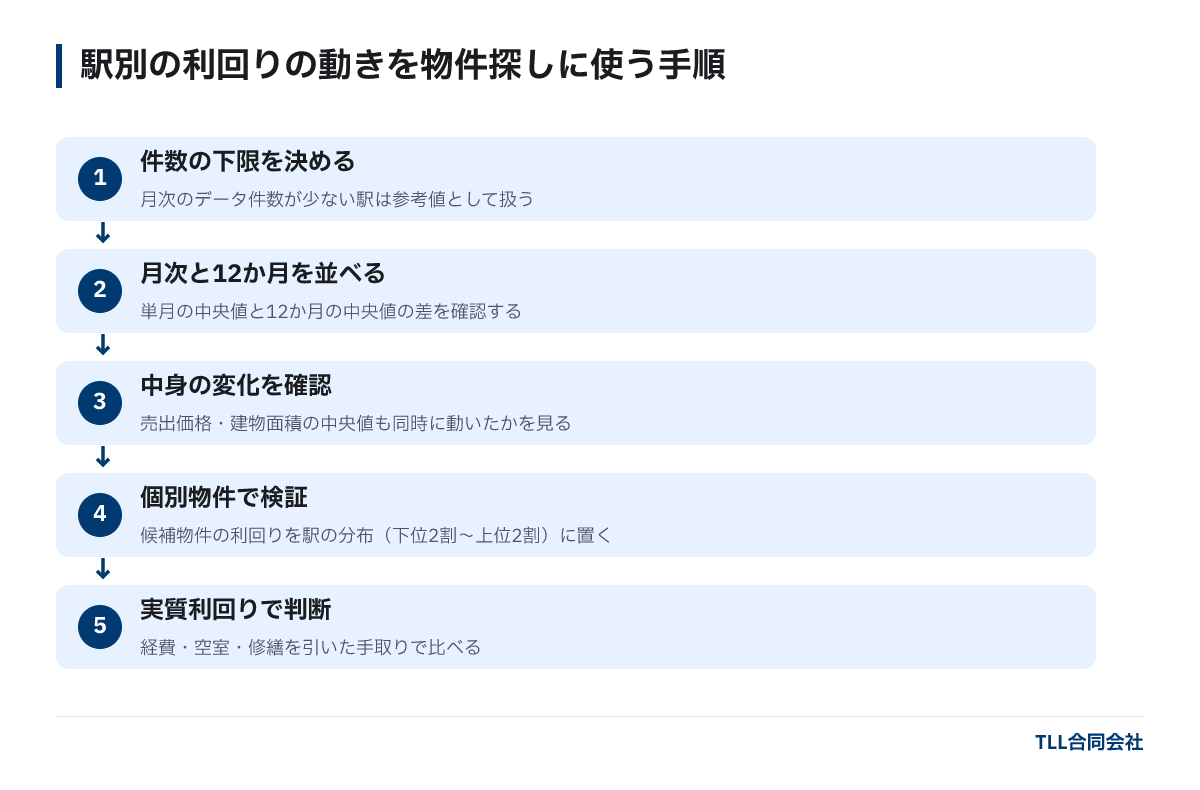
When using station-level yield movements in your property search, confirming the data in the following order helps avoid overreacting to single-month volatility.
- Set a minimum number of listings: Treat data from stations with fewer than 15 listings per month as reference only.
- Compare monthly and 12-month figures: Check how the single-month median compares to the recent 12-month median and its distribution.
- Confirm changes in property metrics: Review whether median listing prices and building areas have moved alongside yields.
- Place individual properties within the distribution: Confirm where your candidate properties’ yields fall within the station’s spread (bottom 20% to top 20%, or 12-month 10th to 90th percentile).
- Judge based on net yields: Compare take-home returns after deducting management fees, repairs, taxes, and vacancy, and consider financing conditions.
The basics of property selection are explained in "How to Choose Income Properties", and the purchasing process in "Income Property Buying Process". Properties handled by TLL are viewable on the Members Page (free registration) and consultations on property search or financial assessment are available under Purchase Support.
Frequently Asked Questions
Q. Does a yield increase at a station mean it is now a good time to buy?
Not necessarily. Since the median by station is influenced heavily by the mix of properties listed in that month, an increase in gross yield does not always indicate a price drop. It is advisable to consider the 12-month median and individual property conditions in your judgment.
Q. Why is the minimum listing requirement set to 15?
Although Urbalytics publishes data for stations with 10 or more listings, months with about 10 to 30 listings are sensitive to changes in just one listing impacting the median. To enhance the reliability of comparisons, this article limits stations to those with 15 or more listings in both May and September.
Q. Can I see year-over-year comparisons by station?
Because Urbalytics only publishes station-level reports starting May 2026, year-over-year comparisons at the station-level are currently unavailable. For such comparisons, please use ward-level reports.
Summary
- Among 20 Tokyo stations with 15 or more listings in May and September 2026, Minami-Senju station showed the biggest gross yield increase (+150bps) and Kanamachi station the biggest decrease (−55bps).
- Yields rose at 14 stations and fell at 6, while the median for Tokyo as a whole remained flat at 5.00%.
- The differences seen in single months are less pronounced when looking at the recent 12-month median (4.97% for Minami-Senju, 5.75% for Kanamachi), suggesting that changes partly reflect shifts in property composition.
- Station-level numbers should be reviewed together with listing counts, 12-month distributions, and net yield calculations, and used as reference for evaluating specific properties.
Featured image (image): Photo: HANVIN CHEONG / Unsplash
About this article
- Author
- Xingkai Luo(New Business)
A business development specialist with over 10 years of experience in urban real estate development and infrastructure investment. At Alibaba and Honeywell, he led large-scale redevelopment projects for major Chinese state-owned transportation operators and oversaw the implementation of smart building solutions. He is deeply familiar with the full development value chain, from due diligence, land acquisition, and structuring through post-completion asset management. At TLL, he leads new business development and project formation for overseas investors, advancing hotel, residential, and mixed-use developments.
View profile → - Publisher
- TLL合同会社宅地建物取引業 東京都知事(1)第108202号住宅宿泊管理業 国土交通大臣(01)第F03424号
Data in this article cite their source and as-of date. Market conditions and regulations change, so check the latest information and consult a professional before deciding. Translated from the Japanese original.