How the Rise in Construction Costs Affects Prices of Used Entire-Building Properties
Xingkai LuoNew Business
19 min read
“Since construction costs are rising, wouldn’t used entire-building properties also increase in price?” This is a common question we hear from owners. Indeed, new construction costs have significantly increased since fiscal 2021. However, whether that directly translates to higher prices for used entire-buildings depends on factors such as property age, location, and financing conditions of buyers.
In this article, we review trends in construction costs and new supply using the Ministry of Land, Infrastructure, Transport and Tourism (MLIT) construction cost deflator and housing starts statistics. Combined with Urbalytics’ used entire-building listing data (past 12 months) from five Tokyo stations, we organize what can happen to used properties when new construction becomes expensive. Finally, we summarize what current owners should verify.
Key points of this article
- The construction cost deflator (housing comprehensive, FY 2020 = 100) is 122.6 in FY 2025, up about 32% from FY 2015’s 93.2 and about 23% from FY 2020 (MLIT, data as of June 30, 2026; FY 2023 onward provisional).
- New rental housing starts in 2025 are 324,991 units, reflecting a 5.0% year-on-year decrease and marking three consecutive years of decline (MLIT Housing Starts Statistical Survey Report - Reiwa 7).
- The median gross yield for used entire-building listings at five Tokyo stations ranged from 4.05% to 5.33% (Urbalytics, October 2025–October 2026, 34–75 listings each).
How much have construction costs risen? Trends in the Construction Cost Deflator
Construction costs accelerated in their rise starting in FY 2021. The construction cost deflator is an index published by MLIT summarizing price changes in construction materials, labor, and related expenses. It is used to compare construction cost levels by fiscal year or month.
| Fiscal Year | Housing Comprehensive | Wooden Housing | Reinforced Concrete Housing | Non-Residential Comprehensive |
|---|---|---|---|---|
| FY 2015 | 93.2 | 93.5 | 92.3 | 92.4 |
| FY 2020 | 100.0 | 100.0 | 100.0 | 100.0 |
| FY 2021 | 108.7 | 110.3 | 105.2 | 104.0 |
| FY 2022 | 115.3 | 116.7 | 111.7 | 110.2 |
| FY 2023 (provisional) | 114.9 | 114.8 | 113.9 | 113.3 |
| FY 2024 (provisional) | 119.3 | 118.8 | 118.9 | 118.5 |
| FY 2025 (provisional) | 122.6 | 122.3 | 122.1 | 121.6 |
Source: MLIT “Construction Cost Deflator (FY 2020 base)” by fiscal year (as of June 30, 2026). FY 2020=100. From FY 2023 onwards, construction investment weights use the provisional average of FY 2020–2022.
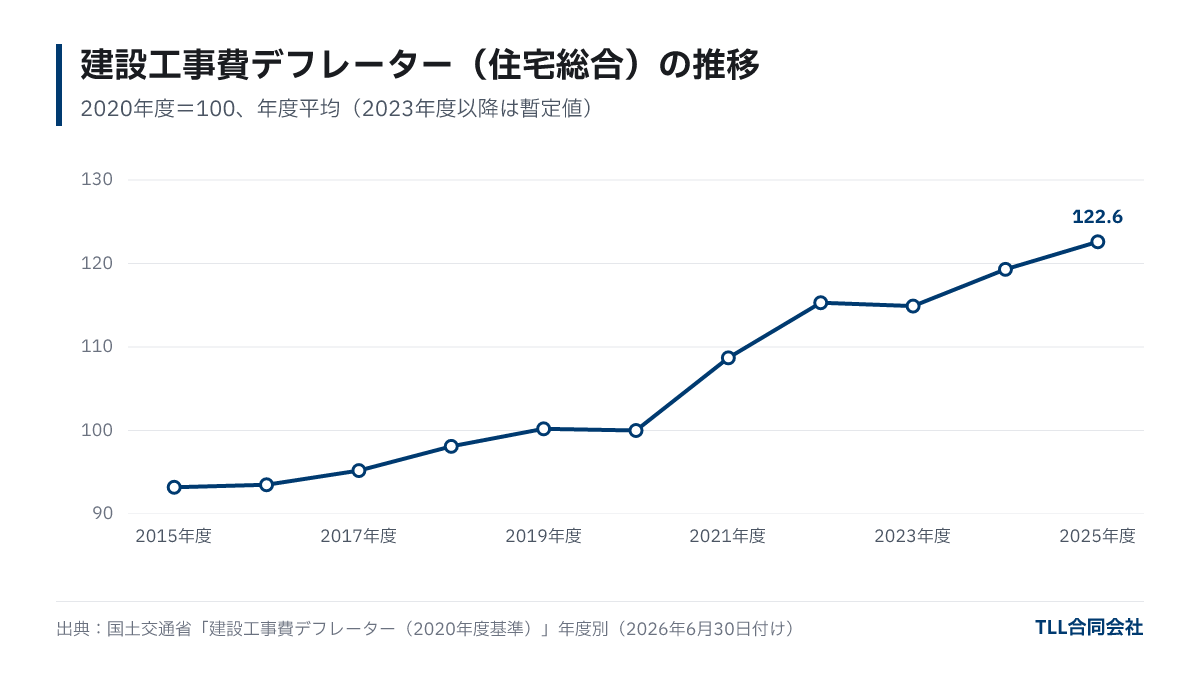
Between FY 2015 and FY 2020, housing comprehensive increased about 7%; from FY 2020 to FY 2025, it rose about 23%. Wooden housing costs rose first in FY 2021–2022, followed by reinforced concrete housing catching up, all converging around 122 in FY 2025. Monthly data (as of September 30, 2026) shows housing comprehensive at 126.3–127.1 from April to June 2026. July’s value was notably higher at 136.0 but monthly figures sometimes get revised due to weight adjustments, so yearly data is more reliable for trends.
Supply of New Buildings: Rental Housing Starts Decline for Three Consecutive Years
Alongside rising construction costs, new rental housing starts have been decreasing. According to MLIT housing starts statistics, the total new housing starts in 2025 (Reiwa 7) were 740,667 units (down 6.5% year-on-year), of which rental housing (kashiya) accounted for 324,991 units, a 5.0% decrease marking the third consecutive yearly decline. In the Tokyo metropolitan area, rental starts decreased by 0.9% year-on-year, a smaller decrease than the national figure (“Housing Starts Statistical Survey Report (Reiwa 7),” published January 30, 2026).
Declines in starts are driven by multiple factors beyond construction costs, such as interest rates, lending attitudes, and responses to legal changes. However, this number matters for owners because it affects “how much new competing properties appear nearby.”

Used Entire-Building Listing Prices and Yields (Past 12 Months)
So what are the current market levels for used entire-building properties? We aggregated Urbalytics listings that were newly posted or had price changes between October 2025 and October 2026 for five Tokyo stations. Duplicate listings were excluded.
| Station | Listings | Yield p25 | Median Yield | p75 Yield | Median Listing Price | Building Price per Tsubo (12-month average) | Quarterly Average Range |
|---|---|---|---|---|---|---|---|
| Ikebukuro | 75 | 3.97% | 4.81% | 5.56% | ¥222 million | ¥3.93 million | ¥3.76m–4.12m |
| Koenji | 74 | 4.07% | 4.59% | 5.26% | ¥180 million | ¥3.61 million | ¥3.26m–4.06m |
| Kameido | 42 | 4.37% | 5.33% | 6.71% | ¥334.5 million | ¥3.56 million | ¥3.20m–3.91m |
| Akabane | 34 | 4.22% | 4.80% | 6.58% | ¥171 million | ¥2.90 million | ¥2.74m–3.24m |
| Sangenjaya | 55 | 3.73% | 4.05% | 4.32% | ¥299.8 million | ¥5.05 million | ¥4.72m–5.60m |
Source: Urbalytics used entire-building (BUILDING) listing data. Aggregation period: October 2, 2025 – October 2, 2026, including properties posted or with price changes during the period (excluding duplicate listings and yields below 1% or above 25%). Yield is gross yield calculated by listed rental income divided by listing price. Building price per tsubo divides land-inclusive listing price by building area (tsubo), weighted quarterly averages over 12 months. Quarterly average range shown only where listing count per quarter exceeded 10. These are listing prices, not transaction prices. Data as of October 2, 2026.
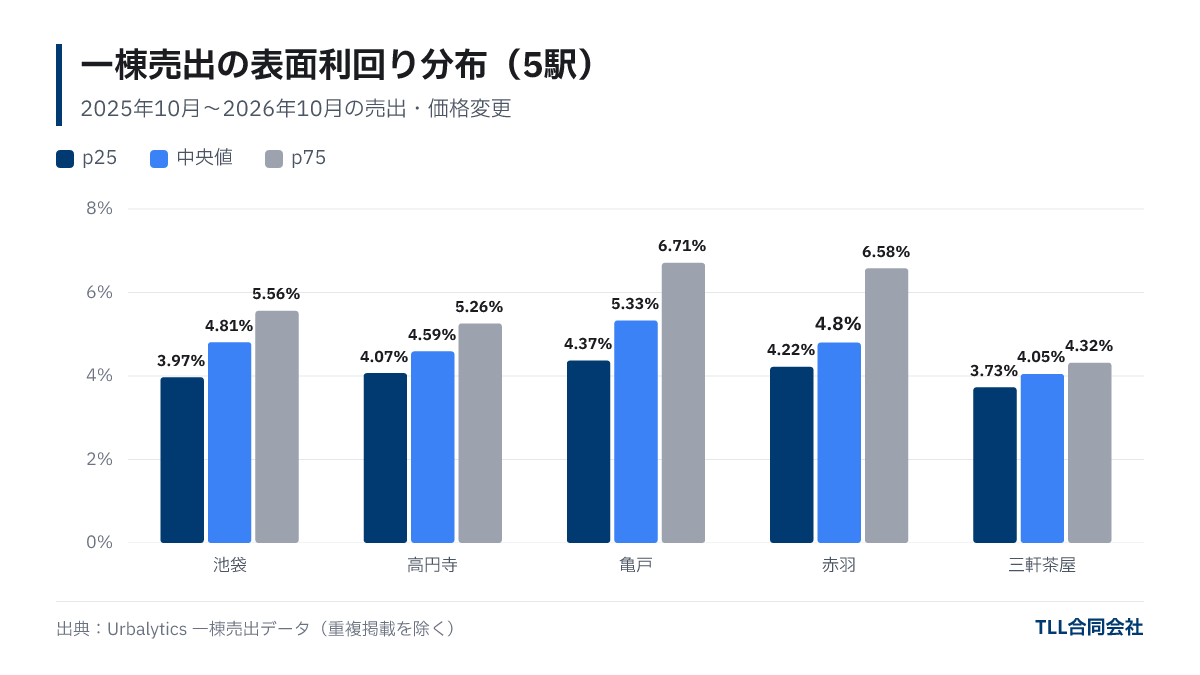
Quarterly average price per tsubo fluctuates significantly within each station, sometimes by about ¥350,000 to ¥900,000. This is because the average changes greatly depending on which properties (age, structure, size) are listed for sale during the period, so these numbers alone cannot be used to read price increase or decrease trends. To see how construction cost increases are reflected in used property prices requires comparisons controlled by building age and structure, and verification of transaction prices.
What Happens to Used Properties When New Construction Becomes Expensive?
The impact of rising construction costs on used entire-buildings can push prices both upward and downward, varying by property. The main four mechanisms are:
- Comparison with new construction: If the increased construction costs cannot be fully passed into rents, yields on new properties will decrease, possibly prompting yield-focused buyers to shift attention toward newer and used buildings.
- Cost-based appraisal: Financial institutions’ cost-based appraisal (sekisan hyouka) values buildings based on the “current cost to rebuild.” If the replacement cost per unit rises, valuation tends to increase especially for newer properties. However, cost unit values vary by financial institution.
- Decline in new supply: Fewer rental housing starts mean fewer new competing properties nearby, which can support occupancy and rents of existing properties.
- Rising repair and rebuilding costs: Conversely, large-scale repairs and restoration costs also rise. For older buildings, repair costs can pressure operating income, and if a property is valued primarily as land for rebuilding, rising demolition and construction costs can push prices downward.
Additionally, interest rates and rent levels greatly influence prices. The relationship between yields and interest rates is explained in our article on reading market conditions with gross yield and interest rate spreads. It is realistic to approach pricing with the understanding that construction cost alone does not determine used property prices.

What Current Owners Should Check
To apply construction cost trends to your own property, confirming the following four points makes judgment easier.
- Replacement cost and fire insurance: Understand how much it would cost to rebuild the same building now, and confirm with your insurance company whether your fire insurance coverage amount matches the rise in construction costs.
- Repair plan estimates: Repair estimates from several years ago may no longer be sufficient at current unit prices. Update estimates for next large-scale repairs such as exterior walls, rooftop waterproofing, and plumbing.
- Nearby new supply and rents: Check whether new rental properties are increasing nearby and how asking rents are moving.
- Valuation from both cost and income perspectives: When considering selling, the buyer’s loan amount is based on both cost-based and income-based valuations. The concept is explained in detail in our article on income property pricing and bank appraisals.
How construction cost increases impact your property valuation can only be confirmed individually. Our article on apartment building appraisal explains appraisal methods, and the free appraisal service can provide a price estimate based on current rent and nearby listings and transaction examples.
Frequently Asked Questions
Q: If construction costs rise, do prices of used entire-building properties also increase?
It cannot be said categorically. While comparison with new construction and cost-based appraisal may push prices upward, higher repair and reconstruction costs tend to pressure prices downward. Interest rates and rents also strongly affect this, and results vary depending on building age, structure, and location.
Q: What is the construction cost deflator?
It is an index published by the Ministry of Land, Infrastructure, Transport and Tourism showing price changes in construction costs. Housing comprehensive, set to 100 in FY 2020, was 122.6 (provisional) in FY 2025.
Q: Should I review my fire insurance in response to rising construction costs?
If the policy limit is below replacement cost, you may not receive sufficient compensation in case of damage. If construction costs have risen since your contract, we recommend confirming coverage adequacy with your insurance company or agent.
Q: Is new supply declining?
New rental housing starts nationwide were 324,991 units in 2025, marking three consecutive years of decrease (MLIT). In the Tokyo metropolitan area, rental starts fell by 0.9% year-on-year, less than the national decline.
Summary
- The construction cost deflator (housing comprehensive) rose from 100 in FY 2020 to 122.6 (provisional) in FY 2025, a 23% increase over five years.
- Rental housing starts in 2025 were 324,991 units, down 5.0% year-on-year, marking a third consecutive year of decline.
- Median gross yields for used entire-building listings at five Tokyo stations ranged from 4.05% to 5.33%. Average price per tsubo fluctuates widely each quarter by property composition, so trend judgment requires comparisons controlling for age and structure.
- Rising construction costs influence used entire-building prices both upward and downward; it is practical for owners to check replacement cost, repair estimates, nearby supply, and financing evaluations for their own properties.
Featured image (illustration): Photo: Samuel Regan-Asante / Unsplash
About this article
- Author
- Xingkai Luo(New Business)
A business development specialist with over 10 years of experience in urban real estate development and infrastructure investment. At Alibaba and Honeywell, he led large-scale redevelopment projects for major Chinese state-owned transportation operators and oversaw the implementation of smart building solutions. He is deeply familiar with the full development value chain, from due diligence, land acquisition, and structuring through post-completion asset management. At TLL, he leads new business development and project formation for overseas investors, advancing hotel, residential, and mixed-use developments.
View profile → - Publisher
- TLL合同会社宅地建物取引業 東京都知事(1)第108202号住宅宿泊管理業 国土交通大臣(01)第F03424号
Data in this article cite their source and as-of date. Market conditions and regulations change, so check the latest information and consult a professional before deciding. Translated from the Japanese original.