Xingkai Luo

Xingkai Luo

New Business

Works on new business opportunities by assessing changes in local markets through his experience in urban development and infrastructure investment.

Overview

He has more than ten years of experience in urban real estate development and infrastructure investment. At Alibaba and Honeywell, he worked on major redevelopment and smart-building projects, with experience across land acquisition, due diligence, project structuring and operations after completion. At TLL, he handles new business development and project structuring for overseas investors. When considering hotel, residential and other uses, he examines construction costs, nearby supply, transport access and operating requirements together. His redevelopment articles look beyond project scale to completion schedules, access during construction and the effects on existing rental properties.

Experience & education

Professional Experience

Alibaba

Education

Beijing Jiaotong University - Industrial Engineering Master

University of Missouri - MBA
TLL Columns

Articles on Urbalytics

Shinjuku Central Park’s planned 39-story tower: What it means for nearby rental valuations

Shinjuku Central Park’s planned 39-story tower: What it means for nearby rental valuations

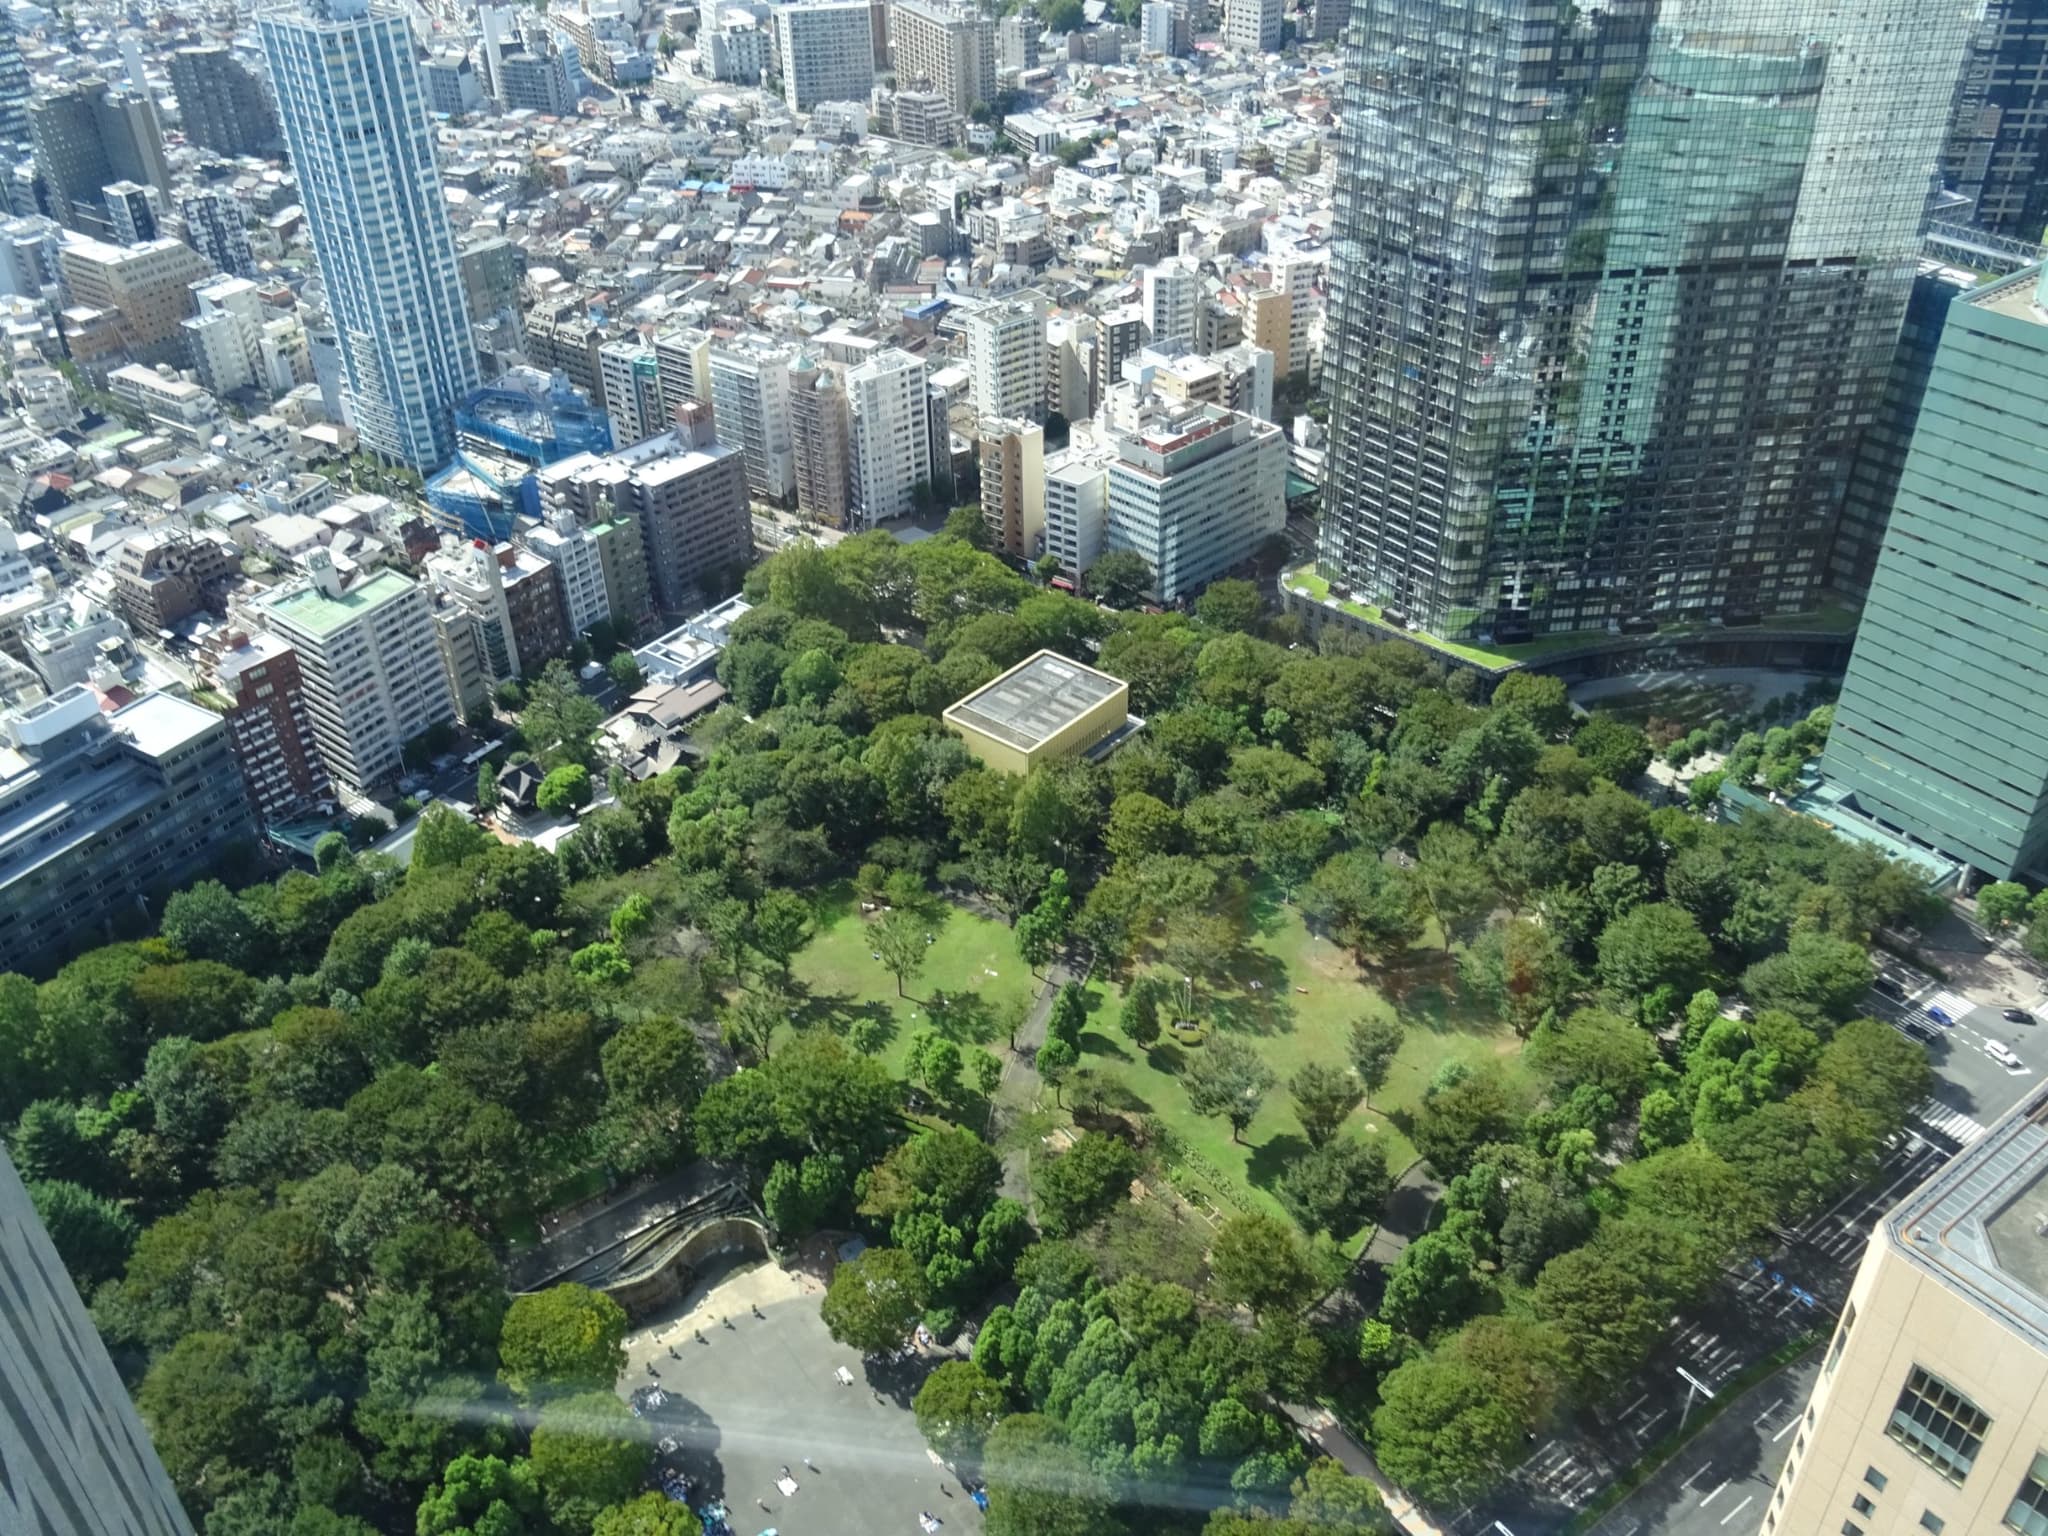
A redevelopment proposal has been presented for the blocks northwest of Shinjuku Central Park, but valuations for nearby rental buildings should still be anchored to today’s achievable rents.On the park’s north side, a pocket of blocks wedged between high-rises is slated for redevelopment. Kenbiya reported on the proposal on Oct 21. Materials from Shinjuku Ward’s Sept 4 landscape council set out the proposed building scale and schedule.The plan includes a 39-story, approximately 160 m-tall mixed-use tower. Commercial and office uses are planned below the residences, with planting and spaces for walking and stopping around the perimeter. For owners of nearby rental buildings, key items to track are how daily tenant routes may shift, and which existing stock the new tower will compete against for demand.Where the proposal stands before constructionThe project is provisionally titled “Nishi-Shinjuku 6-chome West / Shinjuku Central Park Northwest District Type 1 Urban Redevelopment Project.” It sits northeast of the Kita-dori and Junisha-dori intersection, facing the park across the street to the south—a transition zone between the Nishi-Shinjuku office cluster and residential streets to the west.The outline submitted by the redevelopment preparatory association to the ward’s landscape council specifies: site area approx. 4,100 m²; total floor area approx. 63,000 m²; two basement levels. Concentrating development in one building would free space along the street edges. Together with the lower-floor shops and offices, this would connect the site more closely to surrounding streets.The indicated schedule targets: Urban Planning Notification in FY2027, start of construction in FY2031, and completion in FY2037. Japanese fiscal years run from April through March of the following year. As of this writing, these are targets; reporting to the landscape council does not equate to a finalized urban planning decision or a construction permit.Accordingly, owners holding or selling nearby assets in the near term may still exit before seeing the built streetscape. Using post-completion effects to underwrite today’s acquisition price shifts a long waiting period and plan-change risk onto the buyer. The timing gap discussed in phased construction in Roppongi West and valuation of rental buildings likewise needs separate treatment here.Historical area photo, Sep 2018; illustrates the spatial relationship between the park and residential streets, not the project’s current status or completion image. Photo: Christophe95 / Wikimedia Commons, CC BY-SA 4.0; original image unmodified.Assess walkability gains along actual tenant routesWard materials cite narrow streets, insufficient space for walking and stopping, and lack of continuity between green areas as current issues. Diagrams show commercial and office uses on lower floors, residences above, and planted pedestrian space around the perimeter.Such changes could improve the experience of moving from residential streets to the office district or the park. Households with strollers and after-work park users will feel directly whether sidewalks are wide enough and entrances align with their routes. Properties near the site but off this frontage may be affected very differently.Site walks should therefore trace the route from building entry to destination, not just measure map distances. Actual crossing points, gradients, and obstacles determine whether “near the park” converts into convenience. The current plan does not provide evidence to promise direct park access or shorter commutes.If lower-floor shops meet everyday shopping needs, nearby residences could see improved convenience; yet tenant mix and post-opening performance remain to be confirmed. On the supply side, if homes in the new tower are offered for rent, older units with similar layouts may face competition. Our discussion of new supply in Monzen-nakacho and competition for family-oriented rentals likewise suggests separating environmental upgrades from listing-level competition.Shinjuku Central Park area, Feb 2024; depicts existing public space and does not represent post-redevelopment conditions. Photo: Syced / Wikimedia Commons, CC0.Current rents define comparable ranges—not a direct redevelopment premiumTo gauge asking levels for mid-size units nearby, we queried Urbalytics for 40–80 m² apartment listings within a 15-minute walk of Nishi-Shinjuku Station. This station-based catchment spans a broader surrounding market and is not the block immediately fronting the project.104 listing records show a median base monthly rent of JPY 269,500, with the 25th percentile at JPY 220,000 and the 75th percentile at JPY 332,500. For owners with units in this size band, this distribution is a starting point for comps: if your listing sits in the lower range, compare building age, floor level, and interior condition before assuming the median rent is achievable.The median unit rent is about JPY 5,381/m² per month. It answers a different question than total monthly rent: the former helps compare rents per square metre across different unit sizes, while the latter reflects the advertised monthly rent before fees. The two medians need not correspond to the same unit. Dividing one by the other does not establish the floor area of a representative apartment.Whole-building assets form a separate sample. A separate query using the same station and walking-distance criteria, with a listing/price-change date window, returned seven whole-building records: median gross yield 3.81%, with the 25th/75th percentiles at 3.30%/4.26%. With such a small sample, treat this only as an indication of the current asking-yield spread, not a stable pricing benchmark for all of Nishi-Shinjuku.The charts below show two separate samples: apartment asking rents and whole-building gross yields. They cannot be combined to estimate the yield of a single property.A | Nishi-Shinjuku Station apartment asking-rent distribution (Source: Urbalytics; first observed UTC 2025-10-22 to 2026-10-21; not achieved rents)B | Nishi-Shinjuku Station whole-building asking gross yields (Source: Urbalytics; listing/price-change window 2025-10-22 to 2026-10-21; not net yields)Data scope: queried Oct 21, 2026. Rent window uses records first observed between UTC 2025-10-22 and 2026-10-21, taking currently stored base asking rents, excluding management and other fees; residential use, listed status, size 40–80 m², within 15 minutes’ walk, no scan cap reached.Whole-building data are filtered by listings/price changes in the same date window, excluding closed transactions and undisclosed appraisals; seven records after de-duplication. Listed annual income may assume full occupancy or reflect current income, so vacancy assumptions must be checked for each property. Gross yields do not deduct operating expenses or financing costs. The station-based sample is not a precise boundary of the project’s impact area.As broader context, the Shinjuku Ward income-property public monthly report shows a median gross yield of 4.21% across 127 price records in Sept 2026. Its window and sample differ from this station-specific query, so the gap between the two should not be read as a park or redevelopment premium; other area definitions can be cross-checked in the Tokyo market reports.These data have not measured rent changes for the same units before and after project milestones. At this stage, calibrate current positioning using active listings, and wait for construction progress and leasing outcomes to supply new evidence.Base acquisition prices on current income and test future scenarios separatelyWhen assessing nearby rental buildings, the base case should use in-place leases, actual expenses, and verifiable vacancy. Environmental improvements from redevelopment can form an alternate case, but specify start year, which unit types benefit, and the comparable leases underlying the assumptions. A single blanket “redevelopment rent-uplift rate” obscures the conditions that actually require judgment.For assets fronting Kita-dori or Junisha-dori whose tenant routes pass the site, next steps are to check pedestrian-space boundaries and entrance placements once the Urban Planning Notification is issued. On the construction-facing side, evaluate daylighting, noise, and marketing/showing impacts once the work plan is specific; the scale of any disruption is not yet established.For existing stock competing with the new tower, tie upgrade budgets to your target tenant segments. Units that deliver sufficient space at reasonable rent need not chase high-rise fit-out standards. Check which features and living conditions tenants value most before deciding to renovate; this is easier to verify than investing ahead of unproven area expectations.The most actionable next milestone for this area is the Urban Planning Notification targeted for FY2027. When available, rewalk routes from each building to the station and park using the finalized boundary map, then update your income scenarios. Until then, rent benchmarks in acquisition models should be supportable by in-place leases or comparable active listings.Cover: Historical view of Shinjuku Central Park and surrounding residential streets, Christophe95, 2018, Wikimedia Commons, CC BY-SA 4.0; not a project rendering.Tags#NishiShinjuku #ShinjukuCentralPark #TokyoRedevelopment #DistrictRenewal #RentalBuildings #ResidentialLeasing #RentBenchmarks #GrossYield #IncomePropertyValuation #PedestrianEnvironment #JapanRealEstate #UrbalyticsReferencesKenbiya, Oct 21, 2026, report on redevelopment northwest of Shinjuku Central Park.Shinjuku Ward, Sept 4, 2026, 86th Landscape and Town-Building Council and Report 1 planning documents, with focus on PDF pp. 2, 7, and 8.Urbalytics, Sept 2026, Shinjuku Ward income-property market report; station-specific custom methodology per main text.Wikimedia Commons, Christophe95’s 2018 overlook view of the park and Syced’s 2024 park view.
Monzen-nakacho’s planned 780 homes: How should family-rental owners assess the impact?

Monzen-nakacho’s planned 780 homes: How should family-rental owners assess the impact?

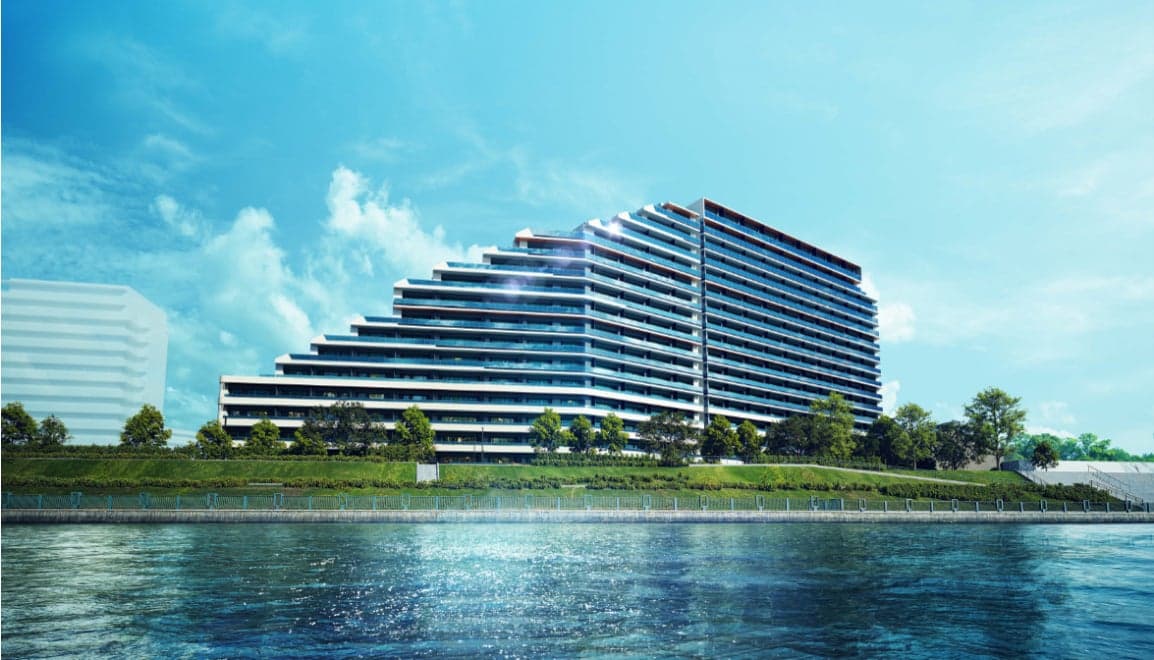
The new Monzen-nakacho district puts for-sale housing, senior residences, and everyday shopping on the same block. Opportunities for nearby rentals should be assessed by target segments and daily-use routes.By Luo | Data verified as of October 16, 2026780 units coming to Etchujima: start by asking whom they serveOn October 16, Nomura Real Estate announced the overall plan for "TOKYO BLUE LINC." The project sits in 1-chome Etchujima, Koto Ward, on about 1.7 hectares owned by Institute of Science Tokyo, concentrating condominiums, senior rental housing, and retail. For nearby landlords, this creates a concrete competitive set: households will compare the new district’s layouts, shared amenities, and shopping convenience against the monthly outlay in existing homes.Of the 780 units in total, Proud City Monzen-nakacho accounts for 667, including 47 non-sale residences; 620 are market-facing for-sale units. OUKAS Monzen-nakacho adds 113 units of senior rental housing with health-support services. These two components differ in move-in criteria, fee structures, and living needs, and should not be lumped together as 780 standard rental units.For existing family rentals, the more direct impact comes from the for-sale condos. Families planning to stay long-term may put renting and buying on the same short list. Senior housing serves a different set of needs; whether it overlaps with conventional rentals depends on eligibility and service fees. Judging competitive intensity by unit counts alone will be misleading.District layout rendering. Source: Nomura Real Estate press release, October 16, 2026. For-sale residences, senior residences, and retail are within the same development area; this is a plan, not an as-built photo.The developer’s timeline: for-sale units are slated to begin sales in mid-November 2026, complete in late December 2027, and start move-ins in late March 2028; the retail and the community building are scheduled to open in Japanese fiscal year 2028 (April 2028–March 2029). Residential occupancy and store openings are not the same milestone. Nearby landlords’ leasing copy and underwriting should align to these two separate dates.New homes change the comparison set; retail changes daily routesThe residences are a 3-minute walk to Etchujima Station and 7 minutes to Monzen-nakacho Station, with access to the Keiyo, Tozai, and Oedo lines. The location straddles Monzen-nakacho’s lifestyle area and Etchujima’s waterfront. Whether surrounding rentals share this convenience depends on the actual route from the building entrance to stations and supermarkets; "being in Monzen-nakacho" alone is not enough.The planned retail includes a supermarket zone exceeding 1,500 sqm plus four daily-convenience blocks. For nearby families, whether grocery shopping is on the way and accessible with children or strollers may matter more than building height. Actual rental performance will need to be tested after opening through usage and leasing feedback.Etchujima Park waterfront, illustrating the existing pedestrian environment around the project, not the construction site. Photo by Ryoma35988, taken September 9, 2007 / Wikimedia Commons, CC BY-SA 3.0, original aspect ratio preserved.The new community’s shared spaces and equipment could also raise expectations among some families when viewing homes. Older stock need not replicate big-project amenities, but should explain what it offers: more usable area, a lower monthly outlay, a room suitable for working from home, or convenience along commute and school-run routes. These differences can be verified in a single viewing and are more persuasive than generic claims of "benefiting from large-scale development."Same-day reporting by Impress Watch noted planned pricing for a 3LDK around 70 sqm starting from JPY 97 million. This is release-phase guidance, not closing records and not a uniform price across all layouts. For rent-to-buy families, it provides a new comparison anchor; for rental landlords, it means you must more clearly present monthly rent budgets versus living conditions.This comparison also involves tenure. The project uses a general fixed-term land leasehold of about 70 years; do not line it up solely by gross price against freehold condos. Buyers should itemize ground rent, management fees, repair reserves, and other long-term outlays. This article does not have the complete final cost schedule and therefore does not convert planned prices into "buy is cheaper than rent." Our earlier condo holding-cost analysis discusses how monthly outlays shift the buy-vs-rent comparison.First set a rent baseline for existing family-sized unitsTo judge who nearby rentals can compete with, first look at the asking-rent band for the same size bracket. Here we limit Urbalytics condo-apartment samples to Monzen-nakacho Station, within a 15-minute walk, 60–80 sqm, to reduce single-occupancy micro-units’ influence.The effective sample is 17 units. The lower quartile of base monthly rent is JPY 249,000, the median is JPY 290,000, and the upper quartile is JPY 353,000. The middle half falling between JPY 249,000 and JPY 353,000 shows that even within this size range, households operate at different budget tiers.Calculating rent per area first for each unit and then taking the median yields about JPY 4,051/sqm/month. Total monthly rent helps gauge a household’s monthly burden, while rent per sqm helps compare a target listing’s size and condition against peers. They answer different questions; do not multiply the per-sqm median by the new project’s size and treat that as its future achievable rent.For ~70 sqm units preparing to re-lease, JPY 290,000 can serve as a starting point to review competing listings. Final pricing should then adjust for building age, floor, layout usability, and the latest leasing feedback. To reach the ~JPY 350,000 budget tier, the unit should demonstrate advantages in size or living conditions, rather than merely citing news about the new project.The top panel shows base monthly rents for 17 condos of 60–80 sqm; the bottom panel shows another set of 27 whole-building sales listings’ gross yields. The two samples are independent and are not merged into a hypothetical income property. Data and charts: Urbalytics, queried October 16, 2026.When acquiring entire buildings, also examine price and listed income. In the same station area and observation window, the 27 valid listing samples show gross listing yield lower quartile around 3.67%, median around 4.20%, and upper quartile around 4.56%. This is a reference for how nearby buildings are being quoted, not a promise of net returns after expenses.This distribution helps frame due-diligence questions: Are the building’s annual revenues based on in-place leases or a full-occupancy assumption? At what rent are vacant units underwritten? If the price only pencils out by relying on rent increases after the retail opens, the investor is effectively bearing a period of waiting for amenity delivery. Isolate that assumption and keep a purchase baseline calculated on current income.Data notes: Observation window is October 17, 2025 to October 16, 2026. Leasing uses the UTC first observed date, currently saved LISTED condo-apartment records, and base rent, excluding management and other fees; the 17 units are a small reference sample, not the full station market and not executed leases. Whole-building stats cover records that listed or repriced within the window; cross-platform duplicates deduplicated; contracted and OFFLINE and outlier yields excluded. Listed annual income may reflect in-place income or assume full occupancy. Vacancy assumptions must be checked for each property; operating costs have not been deducted. Building age and micro-location are not harmonized; neither cross-section measures rent uplift from this development.For broader regional context, see the Tokyo public market report. The station-area samples here and the report’s monthly area aggregates use different filters and should not be spliced into a single appreciation curve.Around 2028, adjust leasing materials and income assumptions separatelyFor landlords already holding family-sized units, you can now benchmark same-size listings and organize base monthly rent, other charges, and property conditions. If a tenant is considering buying, offering a reason to stay based on reasonable outlay is more relevant today than raising rents to chase the new project’s guide prices.As residential handover nears, track the actual move-in pace and any new rental supply around the project. Some for-sale units may later enter the rental market, but there is no verifiable rental ratio today; do not count all 620 for-sale units as comps. When real listings appear, re-compare by layout, rent, and time on market.After the retail opens, walk the route from your building to the entrance again and confirm hours and tenant mix suit your target renters. If convenience truly improves, your leasing materials can show that specific route; your income model should be updated with subsequent asking and signed rents. Our earlier analysis of phased redevelopment in Roppongi also distinguished construction milestones from usable conditions, but here judgments should be anchored to Monzen-nakacho’s own move-in and opening progress.When evaluating an acquisition near Monzen-nakacho, place the target on the project layout map and list the next expected lease turnover alongside the retail’s projected opening. If the current property can already compete within local family budgets, the new amenities are a potential benefit to verify after opening; if the price only makes sense by pulling forward future rent growth, what needs adjusting now is the offer price—not writing unearned income into the rent roll.Cover image: Proud City Monzen-nakacho rendering. Source: Nomura Real Estate press release, October 16, 2026; not as-built. Project images are used to support news analysis of the project; rights belong to the original holders.Tags#MonzenNakacho #Etchujima #KotoWard #TOKYOBLUELINC #NomuraRealEstate #FamilyHousing #ResidentialLeasing #SeniorHousing #FixedTermLandLeasehold #RetailAmenities #GrossListingYield #JapanRealEstate #UrbalyticsSources1. Nomura Real Estate, October 16, 2026: 780-unit integrated resi-retail development in Monzen-nakacho announced, including timeline and project overview.2. Impress Watch, October 16, 2026: TOKYO BLUE LINC coverage, planned pricing information.3. Proud City Monzen-nakacho official site, unit count and project location, verified October 16, 2026.4. Urbalytics Tokyo market report. Filters, samples, and units for rent_stats and building_cap_rate_stats are detailed in Data Notes above.5. Etchujima Park photo and license, Ryoma35988, September 9, 2007, CC BY-SA 3.0.
Roppongi West District Phased Redevelopment: Which Year Should Nearby Rental Assets Price In?

Roppongi West District Phased Redevelopment: Which Year Should Nearby Rental Assets Price In?

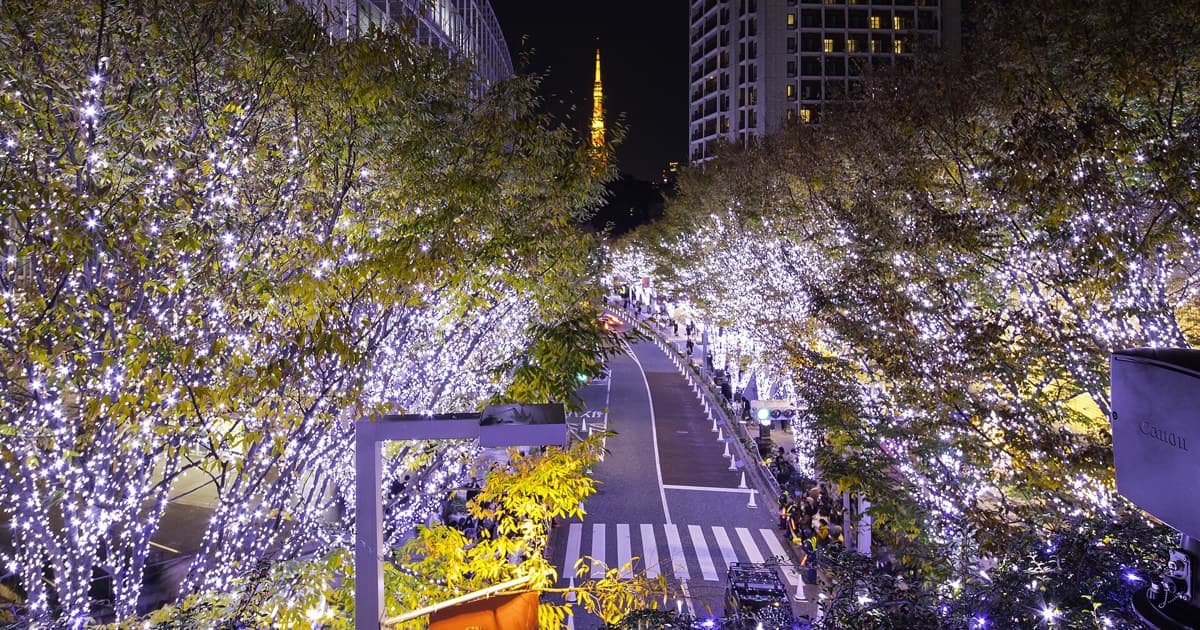
The Roppongi 5-chome West District plan sets phased construction milestones: the core project is slated for completion in fiscal 2032, and the cultural facility in Area F in fiscal 2031. How to value nearby rental buildings depends on how the new facilities tie into routes tenants use day to day, and whether income during the wait can support the acquisition price.Author: Luo | Facts verified as of October 15, 2026The project now has clearer milestones, but surrounding assets should not be valued off the same yearChange in the Roppongi 5-chome West District is moving from supertall massing to how surrounding streets will connect. Today’s Kenbiya report discusses the interplay between Areas F and G and the core redevelopment; Minato City Council disclosures present transport, pedestrian, and cultural exchange functions on a single planning map.Minato City’s September 2 materials state the core redevelopment is planned to start in FY2027 and complete in FY2032; Area F is planned to start in FY2028 and complete in FY2031. These are indicative construction milestones; the actual opening dates and which routes will be continuously usable still require confirmation from subsequent implementation documents.For buyers of nearby rental buildings, the phasing schedule maps directly onto the holding period. The cultural facility may first establish a new destination, with the main building later adding spaces for different uses; the construction environment and future operating conditions a given building faces may not switch over at the same time.Planned milestones per Minato City Council materials (Sept 2, 2026, Document 13). Completion does not equal public opening. Graphic: Urbalytics.The draft district plan covers about 10.5 hectares, with different blocks playing different roles. When assessing a target building, first pinpoint its relationship to the stations, new facilities, and existing retail streets, then decide which plan elements merit inclusion in your holding scenarios.Pedestrian connectivity improves specific routes, and impacts fall on different usersThe plan aims to improve transport nodes and the pedestrian network around stations, linking the Roppongi Hills area to the new development. Such changes can reduce detours and increase cross-street permeability; for existing residences, the effect ultimately comes down to the actual route taken from the front door.Torii-zaka illustrates grade changes on local routes; not a 2026 construction record. Edomura-no-tokuzō, 2017-09-24/Wikimedia Commons, CC BY-SA 4.0, scaled.Daily resident trips to the subway and weekend visitors to cultural venues will not automatically use the same path. If a building sits right where a new passage connects, its convenience may improve; residences on a different slope or deep within a block require reassessing whether the connection is actually on the way.Street-front retail faces another issue. A new destination may increase visits, or it may keep foot traffic inside the complex. For retailers, trading opportunities hinge on whether pedestrians pass the storefront; residential tenants care about ease of return, shopping, and commuting. The income assumptions for the two asset types should not be conflated.Existing Keyakizaka Street at Roppongi Hills; not a 5-chome West District project rendering. Kakidai, December 2024/Wikimedia Commons, CC BY-SA 4.0, scaled.We previously discussed Roppongi Hills vs Shiodome redevelopment, touching on mixed uses and block connectivity; the walking-route analysis at Kami-Itabashi South Exit reminds investors to observe construction-period routes separately from future convenience. These cases help frame questions about routes and uses; this article does not borrow appreciation estimates from other projects to value this area.Start with current listing income, then price the value of future convenienceTo gauge achievable rent for vacant units, compare marketing terms for similar nearby apartments, then compare whole-building income to the purchase price. Here we separately query residential asking rents and whole-building listing gross yields; the former guides re-leasing assumptions, the latter offers a preliminary reference for whole-building pricing.Within the Roppongi and Azabu-Juban station areas, 40–80 m² apartments show median base monthly rents of JPY 335,000 and JPY 299,000, respectively. Calculating unit rent per listing first and then taking the median yields roughly JPY 6,077/m²/month and JPY 6,075/m²/month. Effective samples: 113 and 232 listings.Total monthly rent helps gauge tenant budget thresholds; unit rent per area is better for benchmarking against the target unit’s size and specs. The two stations have similar unit rents but different total monthly rents, showing that focusing only on “how much per month” can obscure differences in size and unit mix; this cross-section also does not track the same apartments before and after redevelopment.In another set of whole-building listings, Roppongi shows a median headline gross yield of about 3.49% (n=13), and Azabu-Juban about 3.21% (n=11). These figures suggest where to begin due diligence: first verify whether the sales brochure’s annual income matches the leases, then determine the re-leasing assumptions for vacant units.Top panel | Residential asking base rent per m², excluding management and other fees. Samples, filters, and observation window described in Data Notes.Bottom panel | Another small sample of whole-building listings; not closed deals and not net cash flow; cannot be combined with the top panel to construct a single income property. Data and charts: Urbalytics.We do not stitch the unit-rent sample and whole-building yields into a hypothetical income property. If the target’s current income cannot support the purchase price and the thesis relies on future rent growth, the construction waiting period must enter the hold analysis; the mere appearance of new facilities nearby does not by itself bridge that income gap.Data notes: Observation window is October 16, 2025 to October 15, 2026 (UTC), filtering Tokyo Metropolis records within a 15-minute walk of the nearest station. Residential limited to MANSION, residential use, 40–80 m², listing status; using base rent excluding management and other fees. Dates reflect the platform’s first observation; values are the record’s current saved figures, not the original listing date or a historical rent-increase series.Whole-building statistics use listed annual income ÷ listing price, without deducting vacancy or operating expenses; current or full-occupancy income must be verified per building. The two station areas may overlap; building age, use, and leasing status are not standardized; the building sample is small and for reference only. Neither dataset represents closed transactions, nor can they be used to measure this redevelopment’s returns.Urbalytics’ Tokyo Open Market Report provides additional ward-level and monthly context. This article filters by station areas and the observation window; the two are not spliced into a pre-/post-redevelopment price trend.Map each construction milestone to the target building’s leases and hold periodFor existing rental buildings, base underwriting should start with verified leases, reasonable re-leasing terms, and property expenses. Then layer in project-induced convenience by staging scenarios according to actual facilities and routes. This clarifies which segment of income is paying for the wait.If leases expire soon after acquisition, first confirm nearby construction arrangements and usable routes during that window. Whether vacant units can be easily shown and whether street-front shops remain easy to enter may affect operations well before the final build-out shown in renderings.As Area F approaches completion, track its actual opening schedule, passage connections, and event usage; as the core project advances, monitor how new uses interact with existing units. The projected completion years provide tracking waypoints; only leases and operating records can verify whether change converts into income.When comparing two buildings near Roppongi or Azabu-Juban, place each on the planning map and line up against its next lease roll. If one will face detours sooner and the other is more likely to connect to a new passage, they should not receive the same development uplift simply because both sit in the same station area.The cover photo shows the Roppongi Hills Keyakizaka illumination in December 2024 and is not a rendering of this project. Photo: Kakidai/Wikimedia Commons, CC BY-SA 4.0. The cover is cropped; scaled versions in this article use the same license.Tags#Roppongi #RoppongiWestDistrict #Minato #AzabuJuban #TokyoRedevelopment #UrbanRenewal #PedestrianConnectivity #RentalBuildings #ResidentialLeasing #ListingYield #HoldAnalysis #JapanRealEstate #UrbalyticsReferences1. Kenbiya, October 15, 2026, Report on Roppongi 5-chome West District redevelopment and surrounding improvements.2. Minato City Council, September 2, 2026, Roppongi 5-chome West District District Plan Amendment (Draft), Document 13.3. Urbalytics, Tokyo Open Market Report; the station-area window and definitions used here are described in the text and evidence log.4. Photo sources: Torii-zaka, Edomura-no-tokuzō, September 24, 2017; Keyakizaka, Kakidai, December 2024. Both under CC BY-SA 4.0.
Fuchinobe South Exit to Relocate Six Public Functions into the Park: Where Are the Opportunities for Rental Buildings?

Fuchinobe South Exit to Relocate Six Public Functions into the Park: Where Are the Opportunities for Rental Buildings?

Fuchinobe’s public-facility renewal is entering the tendering phase. Whether nearby rental buildings benefit will depend on tenants’ daily routes and the eventual use assigned to the station-front land.Author: Luo | Facts verified as of October 13, 2026Relocate public functions first; station-front land is a separate decisionThe update at JR Yokohama Line Fuchinobe Station’s South Exit is moving from planning debates to concrete procurement. A Kenbiya report on October 13 brought it back into investors’ view; Sagamihara City’s project page shows that on September 8 the city published revised tender documents (based on the competitive dialogue results).This phase addresses public facilities already in use. Six existing functions—including the library and audio-visual media library, Ono-Kita Community Center, and community administrative services—will be consolidated into a multi-purpose facility inside Kanuma Park. The park itself will be updated. Understand this first: dispersed destinations will be centralized, and residents’ routes for errands and leisure may shift accordingly.The latest Requirements Specification sets the multi-purpose facility’s gross floor area at about 7,500 sqm, with an opening deadline of before March 2031; Kanuma Park’s full reopening deadline is before March 2034. The operator will propose exact dates within these limits. These are tender requirements—they do not mean the facilities are built or imminently usable.After relocation, the former station-front sites still require a use decision. The city defines the park and multi-purpose facility as Phase 1, and the post-relocation land utilization and station-front bicycle parking renewal as Phase 2. Having procurement documents for Phase 1 does not mean Phase 2 has confirmed residential supply.This distinction affects pricing. If marketing materials bundle the library relocation, mall construction, and new housing into a single near-certain storyline, investors should unpack the evidence behind each item. Confirmable facility updates can inform holding-period context today; undecided private uses should remain in scenario analysis.Kanuma Park, Shiratori Pond, August 27, 2022 on-site photo; not the current construction site. Photo: 海獺 / CC BY-SA 4.0.Convenience propagates along use routes—and redistributes foot trafficOnce the facilities are consolidated, nearby housing may enjoy clearer day-to-day convenience: borrowing books while taking children to the park, or bundling administrative errands with regular trips. For units close to the park and with easy station access, this usage pattern explains tenant fit better than a generic “inside the redevelopment zone” label.Convenience is not just the straight-line distance from building to park. From a resident’s front door, needing to cross busy intersections or walking through poorly lit segments at night changes the experience. Within the park, entrance locations and usable areas during construction also shape how family tenants use it.The city’s Basic Plan notes morning peak mixing at the South Exit intersection and identifies the need to renew the station-front bicycle parking. For tenants who cycle to the station, the location and user conditions of the parking are core to their commute. Adding a public destination in the plan does not offset the inconvenience of a longer or more complicated bike-parking route.Streetfront shops face a different shift. Visits previously tied to the community center and similar facilities may pivot toward the park; shops along the new routes may gain fresh demand. This mechanism is a valid research angle, but whether a shop benefits depends on its target customers and opening hours—do not apply residential rent logic directly.What ultimately goes onto the station-front land will further alter competition. The 2024 private-sector sounding published by the city included concepts combining commercial and residential uses and proposals to co-operate bicycle parking with other facilities. These are feasibility ideas from companies, not city decisions on what will be built.If housing is added later, existing rentals should watch for the simultaneous arrival of new residents and new competing stock; if commercial or community services are added, impacts will be more about shopping and daily use. Applying a uniform “development premium” to all units now would prematurely bake uncertain uses into certain income.Three-station samples describe today’s listing conditions; they cannot price future usesTo evaluate Fuchinobe rentals, start with a current rent benchmark. Using Urbalytics, we queried Kanagawa residential listings from October 14, 2025 to October 13, 2026, filtering for units within a 15-minute walk of the station and 40–80 sqm, and compared them with Yabe and Sagamihara on the Yokohama Line.Median advertised unit rent at Fuchinobe is about JPY 2,409/sqm/month, versus JPY 2,118 at Yabe and JPY 2,495 at Sagamihara. De-duplicated samples numbered 78, 42, and 75, respectively. Under these filters, Fuchinobe is close to Sagamihara and above Yabe—an initial compass for targeting similar tenants.Median monthly total rents are JPY 115,500, JPY 95,000, and JPY 117,000, respectively. Unit price compares listing levels across tenants; total rent checks budget conditions for specific leases. These are separate medians—do not divide them to claim a regional “standard unit size.”For whole-building pricing, we separately checked listed gross yields for entire buildings under the same date window and walk-distance filter. Median gross yields were about 6.80% at Fuchinobe, 6.98% at Yabe, and 7.07% at Sagamihara, from 33, 19, and 30 buildings, respectively. Fuchinobe listings do not show meaningfully higher yields in this comparison set.These figures help screen quotes but cannot value a specific building. Whole-building gross yield is derived from listed annual income and asking price, before operating expenses. Whether annual income assumes full occupancy or current income must be checked listing by listing. Vacancies, capex needs, and in-place leases at the target asset determine whether the marketed income is achievable.Data notes: Residential and whole-building are different samples; do not stitch them into a fictional yield building. The residential sample includes condominium units and wood/steel low-rise apartments, without harmonizing age or amenities; the whole-building sample has no 40–80 sqm unit-size filter. Walk sheds of the three stations may overlap; counts are not additive. Queries cover areas around each station without North/South Exit splits, serving as current listing references and not attributing any rent uplift to this public-facility update. Yabe whole-building n is only 19—treat as indicative.Residential advertised unit rent and whole-building listed gross yield, from different samples. 2025-10-14 to 2026-10-13; Kanagawa; walk distance ≤15 minutes. Residential 40–80㎡; whole-building has no such size filter. Residential n=78/42/75; whole-building n=33/19/30. Source: Urbalytics.For holding decisions, separate what rents today from what may improve tomorrowThe practical value of the Fuchinobe update is to help investors specify whom a building serves. For family-oriented units, investigate actual usage links with the park and public facilities; for assets relying primarily on commuting demand, prioritize station routes and bicycle-parking conditions. These tenant types will not necessarily pay more rent for the same environmental change.At acquisition, base income should start with in-place leases. Calibrate vacant units to comparable listings with similar size and specs, then cross-check the actual South Exit routes. Marking up Year 1 projected rent solely because a new public building will open skips the lag between facility opening and tenants’ willingness to pay.Construction impacts should be assessed by location. For residences near park entrances, monitor hoarding lines and partial openings; for assets along key connectors, track access changes. Record actual viewer feedback at each re-listing to judge whether to adjust marketing or terms—no need to preemptively haircut income for the entire station area.Only after Phase 2 uses are officially announced is it appropriate to discuss supply competition further. If new rental housing appears, compare unit sizes, specs, and delivery cadence; if new commercial space appears, re-check footfall directions for streetfront units. Keeping these paths separate avoids using a single optimistic assumption to cover all future states.Urbalytics’ Kanagawa public market report offers an entry point for ongoing monitoring; as of verification, the latest compiled month is September 2026. Its regional monthly lens differs from this article’s roughly one-year station-area samples and should be viewed separately. Our earlier Sagamihara Station North Exit transit and development analysis covers another infrastructure issue on the same Yokohama Line; the Hachioji South Exit public-space update analysis compares public facilities and residential usage. Neither substitutes for Fuchinobe’s leases and use decisions.For investors actively touring assets, next steps can be codified into a checklist: in-place leases and comparable listings for the target building; actual routes from the front door to the station and park entrances; and official updates on Phase 2 municipal land uses. Only improvements that link to target tenants’ usage needs belong in that building’s income scenarios; until then, price against what can be leased today.Cover and inline photo: Kanuma Park, Shiratori Pond, historical photo from August 27, 2022; not a current construction site or a completed rendering. Photo: 海獺 / Wikimedia Commons, CC BY-SA 4.0. Cover cropped; used under the same license.Tags#Fuchinobe #FuchinobeStation #KanumaPark #SagamiharaCity #YokohamaLine #PublicFacilities #UrbanRenewal #StationFrontMunicipalLand #RentBenchmarks #WholeBuildingIncomeProperty #BicycleParking #KanagawaRealEstate #UrbalyticsReferencesKenbiya, 2026-10-13, coverage of Fuchinobe Station South Exit public facilities and municipal land utilization (full article read)Sagamihara City, updated 2026-09-08, Kanuma Park and multi-purpose facility development/operation project; Revised tender documents (Requirements Specification: gross floor area; facility opening and full park-opening deadlines).Sagamihara City, March 2025, Basic Plan for Kanuma Park and multi-purpose facility development (Phases 1 and 2; transport issues)Sagamihara City, 2024-01-31, 2023 private-sector sounding results (use concepts and conditions for project viability)Urbalytics, Kanagawa public report; this article’s custom three-station listing and listed-yield statistics queried 2026-10-13; filters and samples per data notes
Kami-Itabashi to get a 3,900 m² station-front plaza: For rental buildings, first price in the detour years

Kami-Itabashi to get a 3,900 m² station-front plaza: For rental buildings, first price in the detour years

The transport plaza at Kami-Itabashi’s South Exit has a defined plan, but returns on rental buildings should start from today’s walking routes and achievable rents.Author: Luo | Data verified as of Oct 12, 2026Before the new plaza arrives, start with how tenants get homeA rental building close to the station can become less straightforward to walk to during construction. On Oct 12, Merkmal published a four-page report documenting the detours from the Kami-Itabashi South Exit shopping street to the station, along with merchants’ concerns about foot traffic. The on-site observations were in September; they signal a changing circulation environment but are not enough to assert that every shop’s sales have already declined.Kami-Itabashi’s renewal has clear public-facility targets. The urban planning outline published by Itabashi City lists an approximately 3,900 m² transport plaza and a new road 16 meters wide and about 210 meters long. The road will improve access to the station from the Kawagoe Kaido direction. For housing, whether future space is convenient should be judged against daily commuting and grocery-run routes.The city explains that the South Exit had narrow streets and dense wooden buildings and lacked a station-front plaza and access roads. Redevelopment therefore also carries goals for fire access and disaster resilience. Prices can reflect expectations early, but residents only start using the facilities when the spaces actually open. There is a waiting period between a confirmed plan and realized improvements to daily life.When purchasing nearby income properties, the brochure’s distance-to-station is usually a fixed number. After construction changes entrances and exits, actual user routes may differ; tenants with luggage, strollers, or mobility constraints will feel the changes differently. Rather than applying a uniform premium to the whole station area, a more effective check is to walk from the subject building to the currently available entrance, documenting conditions and any required detours.Area lifestyle context: pedestrian space in Johoku Chuo Park, 2009 historical photo; not the new Kami-Itabashi South Exit plaza or the current construction site. Photo: Kamemaru2000 / CC BY-SA 3.0.Same South Exit, but East and West districts should not be priced on the same timelineThe official outline puts the implementation area at about 2.2 hectares, covering Kami-Itabashi 1-chome and 2-chome. Itabashi City also notes that the East district will proceed first, followed by the West district. The overall urban-planning boundary is not a substitute for each block’s implementation status; seeing construction on one side is not enough to assume facilities on the other will be delivered in the same phase.The same-day report mentioned residential and commercial construction and discussed changes at the former supermarket site at the North Exit. The South Exit redevelopment and North Exit shop updates serve different areas and should be tracked separately by operators. This article does not treat the media-quoted North Exit opening month as a realized supply node, nor present new tenant names as proof that nearby building rents will rise.In a public Q&A updated on Sept 24, Itabashi City lists South Exit access improvements, barrier-free design, and the pedestrian environment as public goals, including a pedestrian corridor, elevators, and an underground bicycle parking lot. The goals are related, but one facility cannot prove that an entire route is barrier-free. Specific listings still need a check of the continuous path from the building entrance to the station.Retailers’ operating concerns differ from residential tenants’ judgments. Shops rely on pass-by traffic; residents care more about entrance usability and the ease of returning home at night. If large in-building retail shifts pedestrian flows, street-facing shops may face new competition; residential buildings may gain a different kind of convenience. The income changes for the two cannot be merged into a single “redevelopment dividend.”Itabashi City’s public materials are still being updated. This article uses only area and public-facility plans we directly verified and does not stitch multiple schedules into a definitive completion date. For buildings that will need rapid re-leasing after acquisition, confirm near-term circulation arrangements with the project entity, rather than modeling first-year income solely from brochure visuals of the future.Asking rents are similar across three stations, but total ask depends on unit sizeUsing Urbalytics, we queried residential listing records for Oct 13, 2025 to Oct 12, 2026 in Tokyo, standardized to ≤15 minutes from a station and units of 40–80 m². After de-duplication: Kami-Itabashi 156 records, Tokiwadai 88, Tobu-Nerima 129. The MANSION category includes condominium-type apartments and is not limited to high-rise for-sale condos.The median asking rent per m² is approximately JPY 3,224, 3,018, and 3,132 per m² per month, with median monthly totals of JPY 179,500, 148,000, and 142,000, respectively. Kami-Itabashi’s totals are higher, but per-m² gaps are not as large as totals suggest. The two statistics are separate medians and cannot be divided to construct a non-existent “typical unit.”This filter did not further harmonize building age and specifications, and station catchments may overlap. Therefore, differences reflect asset mix, and counts should not be summed as corridor-wide supply. These samples are suitable for checking whether an asking quote deviates from nearby comparables, but insufficient to prove that redevelopment at Kami-Itabashi has already lifted per-m² rents for all tenants.Over the same date window and station-distance condition, median whole-building listing gross yields are 6.13%, 5.34%, and 5.40%, based on 53, 32, and 68 buildings, respectively. This query does not apply the 40–80 m² unit-size filter; the sample differs from the rent panel. Multiplying unit rents by a building’s gross floor area and then back-solving price with these yields produces results that correspond to no actual property.Gross yield (hyomen rimawari) is the ratio of listed annual income to asking price, before vacancy and operating expenses. Whether annual income assumes full occupancy or current income must be confirmed property by property. Kami-Itabashi’s higher median can be a starting point to re-check property conditions, but it cannot be written directly as superior returns; capex and re-leasing costs will still determine the cash retained.Dual panels: residential asking rent per m² (top) and whole-building listing gross yield (bottom), from different samples. 2025-10-13 to 2026-10-12, Tokyo, station distance ≤15 minutes; residential 40–80 m², whole-building has no such size filter. Rent n=156/88/129; whole-building n=53/32/68. Source: Urbalytics.Park and retail convenience must be linked by actual routes usedJohoku Chuo Park is an existing local amenity. Redevelopment will not bring a park into the station area for the first time; it may change the routes from housing via the station or commercial spaces. How the planned public spaces connect to existing daily routes still needs to be observed through actual circulation arrangements.For family tenants, both access to green space and everyday shopping can influence unit selection. Proximity to a park does not mean the route is convenient from every building; tenants across wider roads may experience it differently. When viewing, walk the route to the station and to the park separately, rather than using straight-line distance to collapse lifestyle convenience into a single grade.The park photos used here are historical lifestyle illustrations; they do not depict the current South Exit site and do not prove the future plaza is complete. Rely on recent official materials or a site visit for construction progress; greenery in images should not be used as a basis for rent forecasts. The cover and data chart convey different information: environmental observation cues and today’s asking conditions.Lifestyle resource context: Johoku Chuo Park green space, 2010 historical photo; not a completion image of the South Exit redevelopment. Photo: Koujigenba / CC BY-SA 3.0.The same approach applies to our prior analyses of Sagamihara Station North Exit transport and development and Hachioji South Exit public-space updates. They cover different areas and are not price templates, but both show that transport conditions and land use require separate verification.Turn your hold-case into a record you can update step by stepStart verification from the formal scope: confirm the property’s position relative to the East/West districts, read the current official maps, then document the actual entrances and construction detours. Next, check rent terms using listings with similar size and age. After facilities open, see whether your property leases more easily and whether new contract amounts support your original expectations.Until these records form, rents should be grounded in existing contracts and comparable asks. If a short vacancy coincides with construction changes, leave room for waiting and re-leasing. Renovation decisions should center on target tenants’ usage needs—not on chasing a similar facade just because a new building will appear nearby.Urbalytics’ Tokyo public market report and Itabashi City whole-building income property report provide follow-up comparison entry points. The public pages are current to September 2026. Their ward-wide monthly statistics differ in scope from this article’s roughly one-year station-area query and should not be spliced into a single curve to explain pre-/post-redevelopment changes.Kami-Itabashi rental buildings: separate future planning from current operations (Source: Itabashi City public plans and this article’s verification method)At the next move-out, place the construction-period leasing records alongside the prior contract, and note the actually usable entrance and the signed outcome. When the plaza opens, update the same building’s record again. Plaza area can be verified from plans; improvements in rental operations must be demonstrated progressively by your own listings.Cover and pedestrian-space photos: Kamemaru2000 / CC BY-SA 3.0, 2009, cover cropped, original on Wikimedia Commons. Greenery photo: Koujigenba / CC BY-SA 3.0, 2010, original. Both are area illustrations and do not represent current site conditions.Tags#KamiItabashi #KamiItabashiStationSouthExit #Itabashi #Tokiwadai #TobuNerima #UrbanRenewal #Redevelopment #PedestrianEnvironment #TransportPlaza #AskingRents #WholeBuildingIncomeProperty #TokyoRealEstate #UrbalyticsReferencesMerkmal/Yahoo, 2026-10-12, on-site report from Kami-Itabashi (four pages)Itabashi City, updated 2026-03-19, Kami-Itabashi South Exit urban planning outlineItabashi City, East/West district explanationItabashi City, updated 2026-09-24, South Exit public facilities Q&AUrbalytics, Itabashi City public report and the three-station statistics used here (filters in text)
749 Units Coming to Mikawashima: Can the Old Street’s Daily Convenience Retain Rental Tenants?

749 Units Coming to Mikawashima: Can the Old Street’s Daily Convenience Retain Rental Tenants?

The 749-unit plan in Mikawashima will bring new residents and broaden housing options; whether existing rental buildings can retain tenants depends on everyday convenience and living conditions.Author: Luo | Data verified as of October 11, 2026To gauge a street’s value, start with the people who pass through it every dayMikawashima is often presented alongside Shin-Okubo, but the two cannot be valued with the same commercial assumptions. A six-page Toyo Keizai feature on October 11 walked through grocers and eateries around JR Mikawashima Station, portraying a district that has long served local residents. For rental-building owners, the most useful insight is seeing where tenants shop, eat, and head home every day.Such daily-life networks support residential choice, but they do not translate directly into rent premiums. Long-time residents rely on familiar stores and walking routes; newly arriving families will still compare interior space and management quality. Before positioning a street’s cultural character as a listing advantage, owners should state the concrete conveniences it brings to specific households.Redevelopment will introduce new variables into that daily life. Arakawa City’s published project plan targets the north side of JR Mikawashima Station, in Nishi-Nippori 1-chome, covering roughly 1.5 hectares. Underused plots and aging wooden structures are to be assembled for joint redevelopment, concentrating housing and public facilities. The project serves station-front functional renewal and includes disaster-mitigation improvements.Whether legacy shops can sustain operations must be assessed store by store. Merchants’ expectations for new residents are managerial judgments voiced in interviews, not realized sales growth. Where foot traffic from the new tower exits to the street and on which side people spend will affect nearby shops; simply sharing the same station area does not guarantee equal gains for every building.Area reference: Tokyo cityscape viewed from a high-rise near Nippori, historical photo from 2015; not the Mikawashima North project site. Photo: Joon Kyu Park / CC BY-SA 3.0.Within the 749 units, which layouts could compete with existing supply?This verification uses Arakawa City’s 2025 project plan: 749 units are planned, comprising 669 general units and 80 for seniors. The high-rise portion is 43 stories above ground, about 160 meters tall, with total floor area of approximately 89,713 sq m. These are planned values and cannot be used to claim the building is completed or occupied.For rental operators, the unit mix matters more than the headline count. Among general units, 1K/1LDK total 121, 2LDK 226, and 3LDK/4LDK 322; the senior units correspond to 25, 47, and 8, respectively. Larger layouts account for a notable share, but the buyer profile for for-sale product still depends on pricing and actual sales; you cannot infer incremental renter numbers from layout alone.749 units does not equal 749 new rental units. The plan involves continuity for rights holders, and some residents may return; whether the new homes will be rented out and when they would hit the leasing market is not knowable from current materials. Counting all units as direct competition to nearby rentals overstates supply shock; ignoring the substitutability of new homes understates it.An existing small unit and a newly built family unit may be far apart in size and total budget. The more relevant comps are listings that serve similar living needs at rents tenants can afford. When renovating an older building, test whether your layouts fit target households—don’t automatically upscale finishes and asking rents just because a tower is planned.Planned unit mix for the Mikawashima Station North area: general units 121/226/322 and senior units 25/47/8, corresponding to 1K & 1LDK, 2LDK, and 3LDK & 4LDK. Source: Arakawa City published project plan, p. 6; total 749 units; not delivered or net new rental supply.Current asking conditions still diverge; tower expectations are no substitute for rent underwritingUsing Urbalytics, we queried Tokyo residential listings from October 12, 2025 to October 11, 2026, limited to within a 15-minute walk of the station and unit sizes of 40–80 sq m. After de-duplication: Mikawashima 74 entries, Nippori 153, Machiya 175. The MANSION scope also includes wood-frame and light-steel apartment units; not all are high-rise condo stock.Median asking rent per sqm at the three stations was roughly 3,787, 4,461, and 3,774 JPY/sq m/month, with median monthly totals of ¥189,500, ¥220,000, and ¥207,000, respectively. Because totals and unit rates are separate medians, do not divide one by the other to back out a "standard" unit size that no actual listing matches.Mikawashima’s unit rate is close to Machiya’s and below the Nippori sample in this pull. We did not normalize for building age or in-building amenities, so differences also reflect listing composition. Station areas may overlap, and the three counts cannot be summed as a regional total. These serve as reference points for current asking conditions, not proof of how much premium the station itself contributes.Over the same period and station-distance filter, median gross yield on whole-building listings was 5.26%, 4.64%, and 5.05%, based on 20, 22, and 43 buildings, respectively. Samples for Mikawashima and Nippori are small, so a handful of listings can move the median; this whole-building query did not apply a 40–80 sq m unit-size filter and represents a different asset set from the rent panel.Gross yield is listing annual income divided by asking price, before vacancy and operating costs; whether that income is pro forma at full occupancy or in-place must be checked at the listing level. Do not multiply residential asking rents by total building area and combine with these yields to derive prices. Older assets with heavier capex needs may show higher headline yields yet leave less distributable cash.Dual panels: top shows residential asking rent per sqm; bottom shows gross yield on whole-building listings. The two medians come from different samples. 2025-10-12 to 2026-10-11, Tokyo, station distance ≤15 minutes; residential 40–80 sq m; no unit-size filter for whole-building. Source: Urbalytics.Public-space improvements must show up along commute and homebound routesLower floors are planned to host retail and daily services, plus a multi-purpose gymnasium; the plan also provides linear promenades and a plaza. These may improve the station-front pedestrian environment, but actual tenants and operating models require follow-up verification. Do not write "scale sufficient to host a supermarket" as if a specific supermarket brand had been secured.Benefits to nearby rental buildings often occur along the way home. Whether detours shrink, whether it’s easier to reach the station in rain, and whether streets are comfortable at night are more concrete than "a major redevelopment nearby." Buildings slightly farther away may benefit from improved circulation, while those near the site must also consider living conditions during construction.Nippori’s existing mixed-use developments offer an observable comparison: high-rise housing can co-exist with station-front retail, but that does not mean Mikawashima will replicate its rents. Transit options, surrounding stock, and operating quality differ. Comparisons should surface what to diligence in living conditions, not import another station’s pricing.Comparison reference: the lower-level mixed-use space at Nippori Station Port Tower, historical photo from 2014; not the Mikawashima North project or a completed rendering. Photo: Banku / CC BY-SA 4.0.Our past Sagamihara Station North Exit analysis discussed timing gaps between transport engineering and land use, while our Hachioji South Exit renewal analysis focused on how public spaces reshape station-area life. Mikawashima likewise requires step-by-step verification of walking paths and facility arrangements, not just comparisons of total project area.Sources have multiple versions; holding plans should leave room for updatesArakawa City’s October 2025 executive-meeting materials note a total project cost of about ¥64 billion, rights-conversion approval on September 30 of the same year, and a schedule of construction in FY2026 with completion in FY2030. Media that day also cited FY2030 completion, but an older administrative timetable does not prove what construction stage the site had reached by October 2026.Public materials also differ by version. Earlier residential plans showed 750 units; early urban-planning briefs showed around 760. This article uses the 2025 project plan’s 749 and does not stitch the versions into a growth trend. We likewise do not force a single start or move-in month; before acquiring nearby property, confirm the current schedule and road-use arrangements with the project entity.When underwriting hold returns, start with existing leases and comparable current asking conditions, then update achievable rents after new facilities open. If construction noise or circulation changes arise during redevelopment, check the target property’s location specifically. Writing these waiting costs into your model is easier to audit than booking unverified rent growth upfront.Urbalytics’ Tokyo Open Market Report and Arakawa-ku Whole-Building Yield Report can serve as entry points for ongoing monitoring. Arakawa-ku’s public page shows a gross yield of 5.06% across 64 cases in September 2026; this is a monthly, ward-wide metric, different from this article’s near-one-year station-area screen, and should not be strung onto the same trend line to explain redevelopment effects.At the next turnover, keep the prior contract rent on record, then document the adjusted asking amount and the actual signed result; also retain the walking route from the unit to the station. After project updates, only these records will show whether tenants accept the new conditions. The tower’s unit count will be in planning documents; changes in an older building’s rent must still be proven by your own leasing outcomes.Cover and area reference: Joon Kyu Park / CC BY-SA 3.0, historical photo from 2015, cover cropped, Wikimedia Commons original. Nippori comparison photo: Banku / CC BY-SA 4.0, 2014, original. Historical images do not represent the current project status.Tags#Mikawashima #Mikawashima Ekimae North District #Arakawa #Nishi-Nippori #Nippori #Machiya #Urban Renewal #Redevelopment #Housing Supply #Rent Levels #Whole-Building Income Property #Tokyo Real Estate #UrbalyticsReferencesToyo Keizai, 2026-10-11, Mikawashima neighborhood field report (Yahoo reprint verified in full, six pages)Mikawashima Station North District Redevelopment Association, Project Plan (published by Arakawa City, 2025 version)Arakawa City, 2025-10-02 executive-meeting materials, project progress and scheduleArakawa City, earlier residential construction plan (version comparison; unit counts from this version not used)Tokyo Metropolitan Government, early urban-planning project outline (version comparison)Urbalytics, 2026-09 Arakawa-ku public report and this article’s custom station-area listing queries (filters described in text)
After Site Clearance: The supply gap at the 9,471㎡ state-owned parcel by Shinjuku Station

After Site Clearance: The supply gap at the 9,471㎡ state-owned parcel by Shinjuku Station

The land is now visible, but utilization terms have not been defined; nearby rental buildings should be underwritten at current rents, while the state-owned parcel’s future should be assessed separately.Author: Luo | Data verified as of October 10, 2026A cleared site by Shinjuku Station is, first, a retained state assetOn the southwest side of Shinjuku Station, an approximately 9,500㎡ former dormitory site has re-entered public view. On October 10, Toyo Keizai published a four-page feature tracing progress after the closure of the “Sendagaya Housing” complex. Photos of the open lot can easily evoke new housing to come, but the public records verified for this note are not sufficient to confirm any new supply scale or delivery date.Records from the Ministry of Finance’s Kanto Local Finance Bureau list the area as 9,471.25㎡, located in Yoyogi 3-chome, Shibuya-ku. The site sits within Shinjuku Station’s living sphere, yet its administrative ward is Shibuya. When comparing local plans, nearby listings, or statistics, handle station names and administrative boundaries separately; do not apply Shinjuku Ward’s broad indicators just because a headline mentions “Shinjuku.”In the Kanto Finance Bureau’s retained-property list updated on August 19, 2026, the parcel remains a retained asset, with the retention decision dated September 17, 2020. The program’s stated objective is to keep state ownership and consider fixed-term land leasing aligned with social needs. This differs from selling the land to a developer to build for-sale housing.The same page’s table on utilization-policy formulation does not include this No.15 parcel. This indicates the verified public page has not yet provided a policy item; it does not prove there is no internal study. For nearby owners, the public record currently supports the land’s identity and procedural milestones; it does not support the business assumption that ‘the next batch of units is already determined.’Illustrative skyline around Shinjuku and Yoyogi, 2007 historical photo; not the subject state-owned site. Photo: Itoshin87 / Public domain.Demolition design has an award; new supply still requires separate verificationThe feature recounts that the former dormitory was slated for closure in September 2015, followed by local utilization appeals, discussions on land disposition, and demolition preparation. The “no change for years” phrasing describes what residents saw; administrative records show related work did not fully stop. When judging progress, consider the on-site scene alongside specific procurement actions.Among the Kanto Finance Bureau’s design-services procurements is “FY 2026 Design Services for Phase 2 Demolition and Removal of National Buildings, etc. (Yoyogi 3-chome, Shibuya-ku).” The notice date is July 21, 2026, and records show an award on August 21. This primary source supplements the media report: there has been a procurement outcome, but the award concerns design services for demolition.A design award does not mean demolition is complete, much less that new construction has begun. Even if above-ground structures are reduced, land readjustment, subsurface conditions, and utilization terms may still require separate confirmation. We have not obtained soil investigation conclusions; accordingly, we neither write that contamination has been ruled out nor infer definite contamination in the other direction.The finance list indicates the site is in a Commercial Zone with a building coverage/floor-area ratio of 80/500. This helps frame planning context, but it does not directly convert into future household counts or leasable area. Specific uses, building programming, and site constraints have not yet formed a complete, verifiable project brief for this note. Simply multiplying area to estimate returns hides the assumption gap.The cleared condition is only a starting point. To incorporate the parcel into forward supply models, we still need a concrete utilization policy, conditions offered to an implementing party, and a verifiable construction plan. Without these, ‘redevelopment upside’ in nearby ads should be treated as a thesis awaiting validation, not as a realized-rent rationale.Current rents can test hold capacity; they cannot prove future premiumUsing Urbalytics, we queried October 11, 2025 to October 10, 2026 for listings in Tokyo, within a 15-minute walk of a station, and residential units of 40–80㎡. After merging duplicate records with the same building/address, same size, and same rent, Minami-Shinjuku had 10 records, Yoyogi 58, and Sangubashi 49. The MANSION scope includes condominium-type apartments and is not limited to high-rise strata condominiums.The median asking unit rent was approximately JPY 4,545, 5,802, and 4,930 per ㎡ per month, respectively. The median total monthly rent was JPY 229,500, 290,000, and 298,000, respectively. Taking medians separately for total and per-㎡ rents means you cannot divide one by the other to reconstruct a non-existent ‘standard unit.’ A higher total at Sangubashi does not directly imply the highest unit rent.Minami-Shinjuku’s 10 records make it sensitive to a few listings; walk sheds across the three stations may overlap, so counts cannot be summed into an area total. We did not further match building ages or specific blocks; we treat these as references to current asking conditions. We do not read inter-station differences as a pure station premium, and we certainly do not convert them into a rent-uplift forecast after state land utilization.In the same time window and with the same 15-minute station distance, median headline gross yields for whole-building listings were 4.10% (6 buildings) in Minami-Shinjuku, 3.61% (12 buildings) in Yoyogi, and 3.05% (4 buildings) in Sangubashi. These whole-building samples are all small; they are shown as reference values. We do not rank stations on this basis, nor do we treat them as the capitalization rate for the state-owned parcel.A building’s listed annual income may assume full occupancy or reflect current income; headline gross yield does not deduct vacancy or operating expenses. Unit rents and whole-building yields come from different asset samples. Here, Urbalytics helps separate the two pricing conditions; it is not a tool for multiplying residential rents by the site’s area to derive a development return.Two-panel of rents over the past year and whole-building listing headline gross yields; small samples and statistical conditions are described in the text. Source: Urbalytics.Land value, public uses, and nearby old stock are not the same ledgerThe original feature’s title highlighted “over JPY 10 billion,” and the text clarified that this was a simple calculation using area and a posted residential land price, not a rigorous valuation. We do not adopt that number as the land price. Between a large commercial-zone parcel, comparable residential reference points, and actual transactions lie differences in utilization terms and scale that cannot be flattened by a single unit price.For land retained in state ownership with potential fixed-term leasing, value-in-use also depends on lease tenor and intended use. That a program allows a given utilization mode does not mean local lease term, rent, or development sponsor are already fixed. Until such terms are disclosed, nearby investors cannot infer regional capital inflows from a presumed deal sum, nor can they raise their full-occupancy income assumptions on that basis.If the outcome is a public facility or daily-life service, nearby residences may gain convenience through improved daily routes. If leasable residential is added, it may compete with some existing stock. Do not pre-merge these impacts into ‘new facilities will surely benefit old buildings’; effects and competing sets will differ by actual use.For similarly large former sites, the Hachioji South Exit Medical Prison site analysis discusses spatial changes that are already identifiable, while the Sagamihara Station North development analysis emphasizes timing gaps between land use and transport infrastructure. In light of those notes, compare the levels of public decision that are actually disclosed, rather than treating all large clear sites as the same type of project.The most useful investment takeaway for the Sendagaya Housing former site today is a clear boundary between ‘knowns’ and ‘yet to be confirmed.’ Known parcel size and retained status help frame scarcity; unknown utilization terms and supply timing mean the site still cannot carry the underwriting burden for nearby rental buildings’ cash flows.Illustrative night view south of Shinjuku, 2015 historical photo; not the current state of the Sendagaya Housing former site. Photo: calvision / CC0.Underwriting should start from today, then log new administrative milestonesIf nearby sellers have already priced in expected utilization of the state-owned parcel, buyers should separate that expectation from current income. What rent can be collected from current tenants, how long re-leasing may take after move-outs, and how much the next round of capex will require can all be verified against the existing asset. Future land use remains unclear and is insufficient to offset carrying costs during the wait.First, keep current listings of comparable size, age, and commute paths; then track utilization policy, implementing party, and specific construction notices one by one. When demolition progress appears, it updates judgments on site clearance; when use conditions emerge, there is a basis to discuss facility or residential impacts. Do not let the same construction hoarding photo carry inferences for multiple project stages.This station-shed query can be read alongside the Tokyo Metropolitan open-market report and the Shibuya Ward whole-building income property report. Those public pages use monthly cadence and ward-wide scopes; this note uses the past year, specified walk sheds, and a residential size filter. Do not chain the figures into a single trend line.The next update worth tracking should be formal use conditions or project actions that can be matched to this parcel. Note the source, publication date, and specific object, then check whether it alters site clearance, utilization arrangements, or actual supply. Rents must be validated via real listings and leasing outcomes, not inferred from the publication dates of administrative documents.Tags#SendagayaHousingFormerSite #ShinjukuStation #MinamiShinjuku #Yoyogi #Sangubashi #ShibuyaWard #StateOwnedLand #FixedTermLandLease #UrbanRenewal #TokyoRealEstate #RentMarket #WholeBuildingInvestment #UrbalyticsReferencesToyo Keizai, 2026-10-10, investigative report on the Sendagaya Housing former site (four pages)Ministry of Finance, Kanto Local Finance Bureau, list of properties with retained ownership (updated 2026-08-19)Ministry of Finance, Kanto Local Finance Bureau, Recommendation of the 266th Kanto Regional Council on National Property (2020)Ministry of Finance, Kanto Local Finance Bureau, procurement and award records for design and related services (2026)Urbalytics, rent and whole-building listing statistics (2025-10-11 to 2026-10-10; conditions in text)Cover: Night view south of Shinjuku Station, calvision / CC0, 2015 photo (cropped), original on Wikimedia Commons. Daytime illustration: Itoshin87 / Public domain, 2007 photo, original image. Historical photos illustrate area context only and do not evidence the parcel’s current condition.
2,100 New Homes Are Coming to Senju: How AQUA GATE Could Reprice Nearby Rental Buildings

2,100 New Homes Are Coming to Senju: How AQUA GATE Could Reprice Nearby Rental Buildings

Amenity delivery and new housing at Senju Okawabata will roll out in phases. Owners of nearby rental buildings should separately model the impact of improved convenience and incremental supply.Author: Luo | Verification date: October 9, 2026What was announced today is a district to be built in phasesSenju Okawabata will add about 2,100 residential units, but they will not come to market all at once this year. On October 9, the development council announced the district name “AQUA GATE Senju Okawabata,” and Mitsui Fudosan Residential simultaneously launched the website for the first tower. For nearby owners, this provides a clearer construction timeline and makes future competitors tangible.The project is in Senju Sekiyacho, Adachi Ward, adjacent to the Sumida River. The developers’ announced approx. 5.2 hectares refers to newly prepared Areas B and C in the district plan; the entire district-planning area is about 8.5 hectares. Do not conflate the larger urban-planning boundary with the project site, and do not treat the planning area as directly saleable residential area.The site previously hosted factory land and interim leisure uses. Adachi Ward had identified underutilized land and insufficient road and park development as issues. The June 2025 urban-planning notice provided a clear basis for residential development and infrastructure renewal; today’s new name does not mean planning began today.The project is divided into five areas. The developer expects Phase 1 new construction to complete around 2030, and Phase 2 around 2034. The first project, “Park Tower Senju Okawabata,” will be 34 stories and 586 units, targeted for completion in late January 2030 with move-ins in late April 2030. All delivery milestones in this article reflect plans as of October 9, 2026 and are not yet realized.Park Tower Senju Okawabata projected completion CG (rendering), not an actual photo. Source: Mitsui Fudosan Residential press release, October 9, 2026; plans may change.The Kita-Senju catchment must still be broken down into actual commute pathsThe project will leverage Kita-Senju’s transport and retail resources, but the closest stations to the first tower are Keisei Sekiya and Ushida. Officially, Keisei Sekiya is a 3-minute walk, Ushida 4 minutes, and Kita-Senju 14 minutes. Describing the area’s position relative to Kita-Senju is no substitute for measured walking times from the building entrance.This distinction will shape tenants’ daily choices. Walking directly to Kita-Senju to transfer versus walking to Ushida and riding one stop are two different commute experiences. When acquiring nearby older buildings, evaluate specific routes alongside competing listings; simply applying “Senju” to import Kita-Senju core-station rents risks overestimating a property’s letting power.New roads, pedestrian spaces, and riverfront enhancements may smooth routes that previously required detours. These changes can expand the range of acceptable homes, but actual impact depends on opening timelines, public-space usage conditions, and residents’ commute directions. Value attributed to the pedestrian network should be verified only after on-the-ground accessibility improves.The new tower plans 1LDK to 4LDK units with exclusive areas of 46.70 to 108.97 square meters and multiple shared amenities. It will serve some family and larger-unit demand and is not the same product as older apartments with smaller floor plates and lower rent budgets. When assessing competitive intensity, match both unit size and total rent; do not compare only per-sqm pricing.Senju-Shioiri Bridge and the surrounding waterfront area (2016 photo; not AQUA GATE completion). Photo: Nesnad / CC BY-SA 4.0.Nearby rents differ, but do not manufacture conclusions from tiny samplesUrbalytics queried listing records from October 10, 2025 to October 9, 2026, limited to Tokyo, within a 15-minute walk of a station, and residential size of 40–80 square meters. After merging duplicates with the same building/address, size, and rent, valid samples were 158 for Kita-Senju and 67 for Senju-Ohashi. Both sets are asking rents, not signed-lease prices.Median monthly rent per sqm was about JPY 4,426 at Kita-Senju and about JPY 4,142 at Senju-Ohashi, roughly 6.4% lower for the latter. Corresponding median total monthly rents were JPY 191,000 and JPY 179,000. These figures depict existing listings at each station; differences in building age and size mix remain, so do not attribute the entire price gap to the station alone.Ushida had only 5 samples under the same conditions, with a median per-sqm monthly rent of about JPY 3,025. Although closer to the project, this is insufficient for a stable station-catchment read. We do not label this a “price trough,” nor do we project future upside from it. Information gaps in the project’s micro-area should be filled by truly comparable units and new listing records as they emerge.For entire-building assets using the same date window and 15-minute station distance, but without the 40–80 sqm restriction: the median asking gross (headline) yield was 5.14% across 48 buildings at Kita-Senju, and 5.85% across 18 buildings at Senju-Ohashi. The Senju-Ohashi sample is small and should be treated as reference; Ushida had only one building and was excluded from the regional comparison chart.Tenant rents and whole-building yields come from different samples. Do not splice median rent, median price, and median size into a nonexistent “typical income building.” In gross (headline) yield, annual income figures follow the lister’s definition and may be based on a full-occupancy assumption or current income; neither deducts vacancy or operating expenses. Kita-Senju: median monthly apartment rent JPY 191,000; unit rent JPY 4,426/sqm/month; 158 residential samples. Median asking gross yield for entire buildings 5.14%; 48 building samples.Senju-Ohashi: median monthly apartment rent JPY 179,000; unit rent JPY 4,142/sqm/month; 67 residential samples. Median asking gross yield for entire buildings 5.85%; 18 building samples (reference).Urbalytics data takeaway: Within the same living area, rents and whole-building yields are drawn from different asset samples. First match commute routes and unit-budget tiers, then judge whether redevelopment improvements can translate into collectible rent.Urbalytics aggregate query. Dates, station distance, and size conditions are described in the text; the two sets of statistics cannot be stitched into a single building’s yield model.Amenity upgrades and new housing will affect older buildings via different pathsIn Area B-3, Phase 1 plans call for supermarket-anchored retail, followed by multifamily housing in Phase 2. Area B-2 will include service-based senior housing and childcare support functions. This sequencing means nearby residences may first benefit from improved daily convenience, and only later face competition from new housing; impacts may not arrive simultaneously.For existing rental buildings, the value of improved convenience first shows up as easier-to-explain reasons to live there. Shorter shopping routes, more usable riverfront walks, and better public spaces give families one more reason to stay when comparing similarly priced homes. The announcement does not quantify how much these facilities add to rent; do not translate future amenities directly into a certain rent uplift.“About 2,100 units” does not mean 2,100 rental units will appear at once. The project will include multiple residential formats, and the first tower is for-sale condominiums. How many owners will become landlords, at what rent levels, and on what timelines is undetermined. Whether condo buyers choose to occupy will change how much rental supply actually increases.Older stock that most closely overlaps the new project’s unit sizes and budgets—but lacks distinctive features—may face competition first. Lower total-rent units and buildings with unique uses may be affected differently. For each building, use re-letting performance after tenant move-outs to validate the product’s positioning, rather than assuming the whole of Adachi Ward is a uniform beneficiary.Station-catchment price stratification appears in other areas too. Urbalytics’ analysis of the new Senju-Ohashi tower and the second-hand market can extend the discussion on product tiers; Shin-Kamagaya station-front redevelopment and employment-driven demand shows that development scale and sustainable rental demand must be validated separately.Do not price today’s cash flows off tomorrow’s amenitiesThe actual opening of Phase 1 retail is more relevant to leasing operations than a district name. Before new homes reach the market, construction can also bring noise or traffic changes. When holding nearby older buildings, base rent underwriting on today’s viable listing conditions, then separately present scenarios after new amenities are delivered; do not blend them into a single, untested optimistic quote.A building’s sale price can move ahead of delivery on expectations, but rent realization typically requires listings to hit the market. If a seller has already priced-in redevelopment, buyers should review comparable buildings’ operating expenses and exit conditions. “Waiting for completion” does not substitute for modeling interim vacancy loss, CapEx, and carrying costs.The Sumida River waterfront is also part of the plan. The developer proposes combining super-levee disaster-resilience upgrades with open space, but planning measures do not mean all nearby buildings share the same safety profile. Each older building’s evacuation routes, equipment placement, and applicable flood-risk information still require independent verification; do not use the new tower’s disaster-resilience statements as a proxy endorsement for adjacent stock.This article’s data can be read alongside the Urbalytics Tokyo market report and Adachi Ward entire-building report. The public monthly reports and this near-one-year query with specified station distance and size differ in methodology; do not stitch the figures into a single trendline.The next verifiable signals will be named tenants and opening dates, listing records for completed residences, and leasing cycles for nearby comparable unit types. Owners can archive current unit conditions and each re-letting result, then check whether amenity delivery truly shortens vacancy and raises collectible rent. Without such records, nearby price changes remain expectations.Tags#SenjuRedevelopment #SenjuOkawabata #KitaSenju #Ushida #KeiseiSekiya #SenjuOhashi #AdachiWard #TokyoRealEstate #JapanProperty #WholeBuildingIncomeAssets #RentBenchmarks #UrbanRenewal #UrbalyticsSourcesImpress Watch, October 9, 2026, coverage of the Senju Okawabata developmentMitsui Fudosan, October 9, 2026, announcement of the district-wide developmentMitsui Fudosan Residential, October 9, 2026, announcement of the first towerAdachi Ward, Senju Okawabata urban development and planning noticesUrbalytics, aggregated rents and whole-building yields, 2025-10-10 to 2026-10-09; conditions as stated in the textCover and waterfront photo: Nesnad / CC BY-SA 4.0, original on Wikimedia Commons; cover cropped. Project completion CG: Mitsui Fudosan Residential press release. This article is regional data analysis, not sales material for the project.
15 hectares lie vacant at the station front, yet prices are 30% below the Kanagawa average: Sagamihara Station North Exit is bottlenecked by a costly rail elevation

15 hectares lie vacant at the station front, yet prices are 30% below the Kanagawa average: Sagamihara Station North Exit is bottlenecked by a costly rail elevation

The median gross yield for whole-building assets at Sagamihara Station is 7.07%. The market has not priced in the North Exit development; the bottleneck is a railway elevation bill of up to JPY 117.4 billion.Across Greater Tokyo, it is rare to find roughly 15 hectares of almost entirely empty land right outside a JR station exit. The North Exit of JR Yokohama Line’s Sagamihara Station in Sagamihara City, Kanagawa Prefecture, is exactly such a place.The site originally belonged to the U.S. Forces Japan’s Sagami General Depot. After part of it was returned to Japan in 2014, it has been waiting for a development scheme. In August 2025, Sagamihara City finally produced a land-use plan; and this week, Kenbiya reported that the city has launched a preliminary study for a “continuous grade separation (railway elevation)” around JR Yokohama Line’s Sagamihara Station.On one side lies a vast station-front void; on the other, the station with the highest yields and lowest prices along the Yokohama Line in Urbalytics data. Together they make the point: the site’s value hinges on whether the transport link can be delivered.1) From U.S. Army depot to station-front void: Why the North Exit has waited twelve yearsThe Sagami General Depot is a major logistics hub for U.S. forces in mainland Japan, immediately north of Sagamihara Station. In 2014, roughly 17 hectares were returned; net of road and railway corridors, the developable portion is about 15 hectares.Since the return, development proposals have swung back and forth. The city’s early “wide-area exchange hub” concept did not materialize due to feasibility issues; the “city-building concept” was revised in May 2020; land-use policy was set in May 2022; and from July 2024, proposals were solicited from the private sector.Not until August 2025 did the Sagamihara Station North Exit District Land-Use Plan formally take shape, and on October 28 that year the mayor personally submitted it to the landowner—the Kanto Local Finance Bureau of the Ministry of Finance. This marked the shift from “discussing uses” to “negotiating how to dispose of the land.”The north–south arterial road built on the returned road corridor of the Sagami General Depot, viewed from the Sagamihara Station sideThe plan divides the North Exit into several functional zones, with quite specific scales already in place:The residential-priority zone is set on the northwest side, centered on mid-rise multifamily buildings, targeting 800 to 1,000 households, with potential integration of a supermarket, clinic, and childcare facilities.The commercial-priority zone runs along the railway, mainly low-rise, with a total floor area target of 60,000 to 100,000 square meters, aiming to connect the north and south sides of the station into a continuous commercial frontage.The business-priority zone fronts the station plaza and the north–south road, mainly mid-rise, with a total floor area target of 30,000 to 60,000 square meters. The plan also calls for studying a new ticket gate on the west side of the station, and targets district-wide “zero carbon.”2) Data: The highest yields and lowest prices on the Yokohama LineHowever good the blueprint, the question is whether the market has priced it in. Using Urbalytics, we pulled 12 months of listings within a 15-minute walk for four JR Yokohama Line stations.The median gross yield for whole-building income properties at Sagamihara Station is 7.07% (n=30), above Fuchinobe’s 6.81%, Hashimoto’s 6.20%, and Machida’s 6.00%. By price per tsubo (building area), Sagamihara averaged JPY 1.194 million in 2026, notably below Hashimoto’s JPY 1.686 million and Machida’s JPY 1.791 million.Rents, by contrast, have not diverged. The median monthly rent per square meter for rental apartments is JPY 2,554 at Sagamihara (n=292), slightly above Hashimoto’s JPY 2,382, and only about 13% below Machida’s JPY 2,923.Four-station comparison on the JR Yokohama Line: whole-building gross yield, price per tsubo, and rental apartment rentsTaken together, the message is clear: rents at Sagamihara are not weak—what’s cheap is the asset price. This aligns with subcity-level data: Urbalytics market reports show that in September 2026 the median price per tsubo for whole-building income properties in Chuo Ward, Sagamihara City, was JPY 0.932 million, 31.1% below the Kanagawa Prefecture average; condominium units were JPY 358,000 per square meter, likewise 31.3% below the prefectural average.Urbalytics Insight Urbalytics data indicate that rents around Sagamihara Station are on par with or slightly above Hashimoto, but price per tsubo for whole-building assets is roughly 30% lower. The market is currently assigning almost no value to the North Exit development—both an opportunity and a sign that timelines are viewed skeptically. With only 20–30 whole-building samples, treat these as reference values.3) Why elevation is back on the table: one road can’t carry 50,000 vehiclesIf the land and plan exist, why elevate the railway? The answer is traffic.As of FY2018, the city’s stance was that traffic generated by the North Exit could be absorbed by widening the Miyashita–Yokoyamadai Line to four lanes; elevation was viewed as a long-term issue after the depot’s full return.But FY2023 traffic counts show congestion already. Under the current land-use plan, trip generation/attraction in the North Exit area is about 24,000 vehicles per day, while the Miyashita–Yokoyamadai Line’s future traffic is projected at roughly 50,000 vehicles per day. The city concluded that even with four lanes, it may not handle post-development flows.Institutional hurdles have also eased. Previously, to meet national subsidy requirements, the elevated section had to extend to the Obara crossing. After the Sagamihara crossing was designated a “pedestrian bottleneck crossing” in FY2021, the study section can be shortened to between the Yakake Overpass and the West Gate crossing, with Obara handled separately via an underpass.Part of the returned land on the southwest side of the Sagami General Depot, viewed from the direction of Sagamihara StationThe city’s choice is to use elevation as the base scheme. The reasons: it can eliminate two level crossings (Sagamihara and Koyama) in one go, reduce land acquisition in the built-up area, and make it easier to connect north–south pedestrian flows through the station.The bill, however, is large. Prior estimates put the road-underpass scheme at about JPY 65.1 billion, while a railway elevation would require roughly JPY 74.4–117.4 billion, depending on construction method.The key cost difference lies in how it is built. A “separate-line method” that constructs a new elevated alignment on the depot side is relatively cheaper, but requires coordination with the Ministry of Defense and the U.S. military; building elevation directly above the existing line would drive costs up substantially.4) What it means for investors: timelines matter more than blueprintsThis is where the North Exit is easiest to misread. Headlines touting “elevation,” “15 hectares,” and “100,000 square meters of commercial space” are enticing, but the city’s own schedule is much more sober.According to the schedule in the land-use plan summary, it will take 5 to 8 years to finalize the plan and complete urban-planning approvals; only then would land disposition begin, with private development requiring a further 1 to 3 years. For surrounding road networks and other infrastructure, the document states “around 10 to 20 years.”The preliminary study for elevation will be conducted in FY2026, and the city has explicitly stated that elevation itself has not been decided. From FY2026, the city will engage in negotiations with JR East, the Ministry of Land, Infrastructure, Transport and Tourism, traffic authorities, and the Ministry of Defense and the U.S. military.For buy-and-hold investors, this implies two very different approaches:First, if the target is cash flow, a roughly 7% gross yield for whole-building assets around Sagamihara Station is already high for the Yokohama Line, and rents are supportive. Treat the North Exit development as a “free option” you shouldn’t pay extra for.Second, if the goal is to bet on development upside, be prepared to hold for the long term. For the North Exit’s commercial and business facilities to be delivered and true north–south connectivity to be achieved, even the most optimistic case is measured in decades; paying up early offers little advantage.Risk warning Elevation is still at the preliminary study stage; after recent inflation, project costs may need to be re-estimated, and outcomes of negotiations with the Ministry of Defense and the U.S. military will directly determine the construction method and cost. If the project shifts to an underpass scheme or decisions are delayed, both the scale and the timeline of the North Exit development may shrink. Investors wagering on development premiums should build in ample margin of safety.Conclusion: Underwrite cash flow first, then the North ExitThe Sagamihara Station North Exit is a rare “large station-front vacant site” in Greater Tokyo. The plan has been submitted to the national government, and a preliminary study for railway elevation has begun. Yet the data show the market is not paying a premium for this story: whole-building yields remain the highest along the line, and price per tsubo is roughly 30% below the Kanagawa average.That price gap is itself a signal. For investors who value stable returns and can hold long term, the Sagamihara area deserves a spot on the watchlist. For those seeking short-term gains from a “development concept,” the timetable is the first number to pin down.To view monthly trends in gross yield and price per tsubo for Sagamihara City’s Chuo Ward, see Urbalytics’ whole-building income property market report for Chuo Ward, Sagamihara City and condominium unit market report for Chuo Ward, Sagamihara City.For a comparable West Greater Tokyo project led by public land conversion, read our earlier analysis of Hachioji South Exit “Soto no Mori”.For areas centered on planned new stations, see our analysis of the proposed new station on the Oedo Line extension in Niiza City.On the Urbalytics platform, filter whole-building listings by station, walk time, and year built. First make sure the yield underwrites; then consider how much additional upside the development may bring. That is the safer order at this stage.Tags#Japan Real Estate #Sagamihara #Sagamihara Station #JR Yokohama Line #Sagami General Depot #Railway Elevation #Continuous Grade Separation #Redevelopment #Kanagawa Investment #Whole-building Income Property #Gross Yield #Western Greater Tokyo #Japan Property Investment #UrbalyticsReferencesKenbiya, 2026, “Considering railway elevation on the JR Yokohama Line at Sagamihara Station: Can it become the urban infrastructure supporting the 15-hectare North Exit development?”, https://www.kenbiya.com/ar/ns/region/shutoken/10532.htmlSagamihara City, 2025, “Sagamihara Station North Exit District Land-Use Plan [Summary Version]”, https://www.city.sagamihara.kanagawa.jp/_res/projects/default_project/_page_/001/033/744/tochiriyoukeikaku_gaiyou.pdfSagamihara City, 2025, “Sagamihara Station North Exit District Land-Use Plan”, https://www.city.sagamihara.kanagawa.jp/shisei/1026823/koikikoryu/sagamihara/1028021/1033744.htmlSagamihara City, 2025, “We will submit the Sagamihara Station North Exit District Land-Use Plan to the national government (Kanto Local Finance Bureau)” (press materials), https://www.city.sagamihara.kanagawa.jp/_res/projects/default_project/_page_/001/033/937/1017/02.pdfUrbalytics Market Report, 2026, “Whole-building income property market in Chuo Ward, Sagamihara City, Kanagawa Prefecture”, https://www.urbalytics.jp/market/area/kanagawa/chuo-ku/buildingWikimedia Commons, “Sagami General Depot 201909-1.jpg” “Sagami General Depot 201909-4.jpg” (CC BY-SA 4.0), https://commons.wikimedia.org/
03-4566-3208Contact